Combine these 3 charts
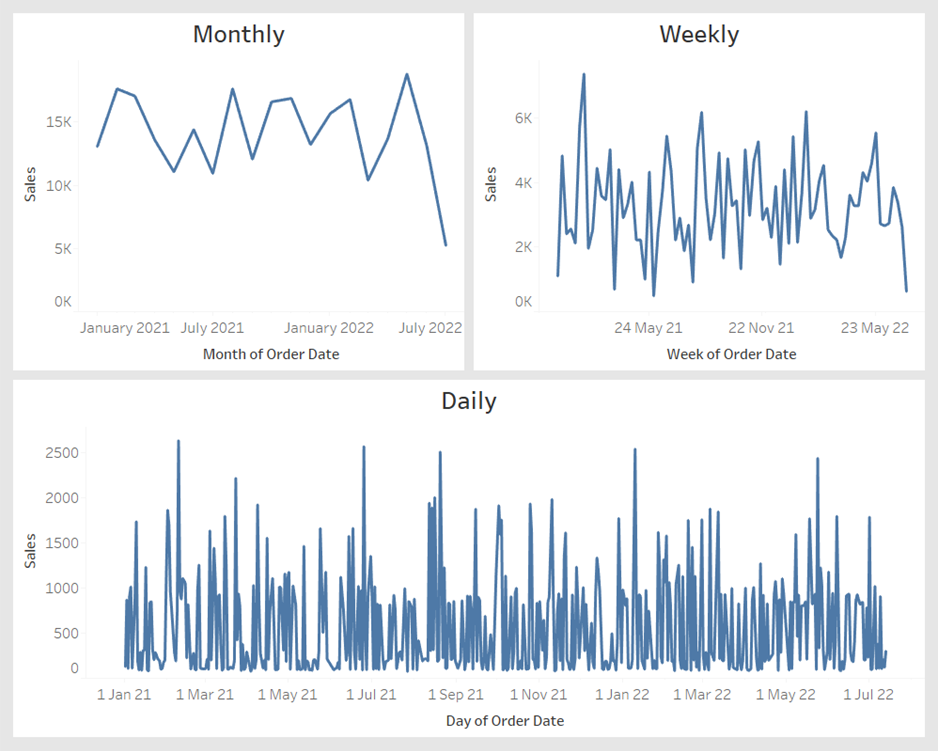
Into one
Follow along in this tutorial to see how this chart is built. Find (1.4) for a more detailed explanation on the datetrunc function.
Step by step instruction.
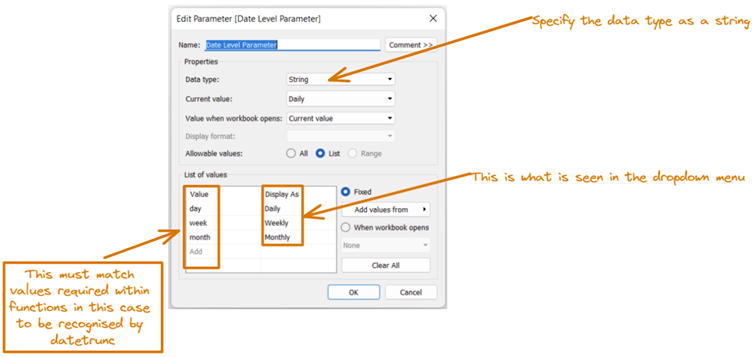
- Firstly you must create the parameter that will contain the values to be entered within the datetrunc function
2.
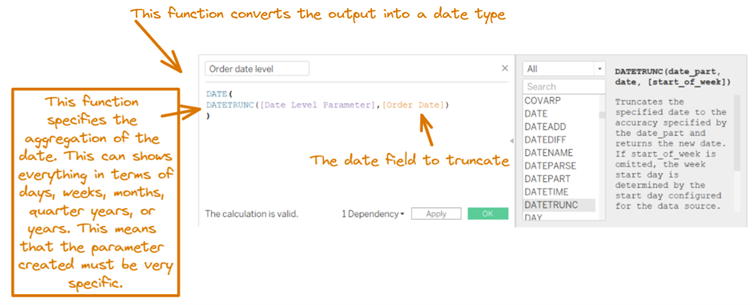
- Enter this into the truncating calculated field
4.
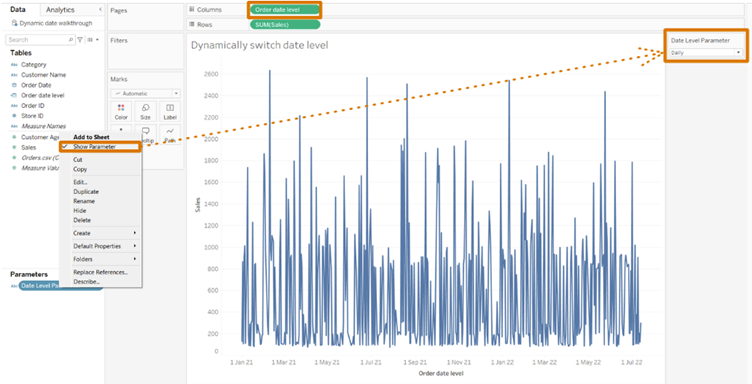
- Then drag into the columns the calcualted field just made and show the paramter
6.