More mysterious than Mystic Meg (how that was ever on TV I will never know), ‘Tablish’ is a way of deciphering some of the more complex actions in Tableau as well as some of the seemingly more simple. Lesson 1 looks at using table calculations, which many of us use but do we really understand them?
Using the superstore data lets say I want to look at what proportion of sales was made up by each category within each state. We would start by sticking in our dimensions and measures required and then perform our table calculation:
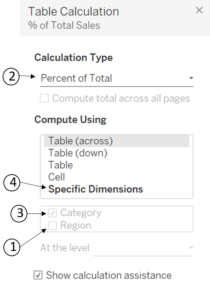
But what we want to look at here is the dialog box we get when we edit the table calculation, what does this mean and how to we translate it into English. Easy, you just need to know the formula.

- For each of the unchecked boxes we say “For each [Region]”
- “Calculate the [Percent of Total]”
- For each checked box we say “by [Category]”
Put it all together and you get “For each [Region] calculate the [Percent of Total] by [Category]”
4. Not a Tablish translation but it is good practice to always click ‘Specific dimensions’ to fix the calculation to the specific fields. If you decide the chop and change your view after you have finished the table calculation, and do not have specific dimensions ticked you will end up with some weird results.
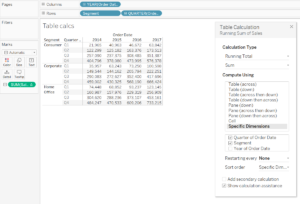
Here is a bit more of a complicated example:

Here we say “For each [Year of order date], calculate the [Sum of the Running Total], by [Quarter of Order Date] and [Segment] “.
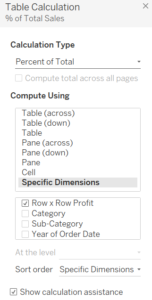
Here is one for you to do yourself:

For the answer highlight the empty space below
“For each [Year of order date], [sub-category] and [Category] calculate the [Percent of total], by [Row x Row Profit]</strong style=”color: #ffffff”>”.
WELL DONE! You have successfully completed your first lesson in Tablish. Keep an eye out for some more coming your way this week where we will be looking at Fixed Level of Detail calculations (link to lesson 2 here.
If you have any questions or would like to leave any feedback please do so via my twitter @DriveMyData.
