For this blog I have decided to look at one of the new Tableau 10.5 features which allows you to have ‘viz in tooltips’. Now aside from the imperatively obvious, click on a customer name in superstore and see a line chart of their spend over time, there is a rather nifty trick that I have been waiting a long, long time for before viz in tooltips, as an idea, was even conceived. And this trick will help you get rid of that damned asterisk!
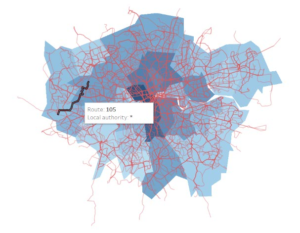
So for our project this week we were asked to look at bus routes data in London. I decided to take a look at crime stats but unfortunately I couldn’t find this by each individual bus route, only by London borough. So what boroughs did these bus routes pass through? In my dashboard I wanted to be able to hover over a bus route and then be able to see each borough, by name. Not a count, not an asterisk(!), but each individual name. If you attempted this in Tableau 10.4, it probably would have looked a little something like this:

That damn *!
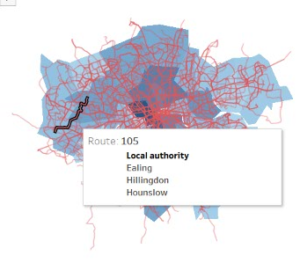
But with a couple of simple steps I could achieve my goal!
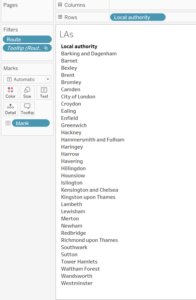
Step 1: Build a worksheet with the list of boroughs. To do this I put boroughs on rows shelf and put a blank field on the text box of the marks card to show null values. I could have put the number of crimes on here instead but I didn’t want it to clog up the tooltip.

Step 2: Stick it in the tooltip on my maps worksheet. To do this you open the Tooltip menu as you normally would by clicking on the tooltip button on the marks card, select where you would like to insert the list/worksheet, hit the ‘Insert’ menu, go to the ‘Sheets’ sub menu, select your worksheets and bobs your uncle.

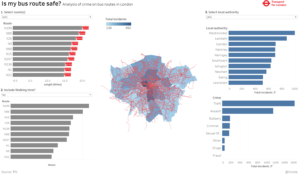
So there you have it, how to insert a list into a tooltip and get rid of that asterix when multiple values exist. I have not uploaded this version to Tableau public yet as it is still running on 10.4, not 10.5 so this functionality will not work, but here is a screen shot of my dashboard…

If you would like to ask any questions or leave me any feedback please do so via my twitter page @DriveMyData.
