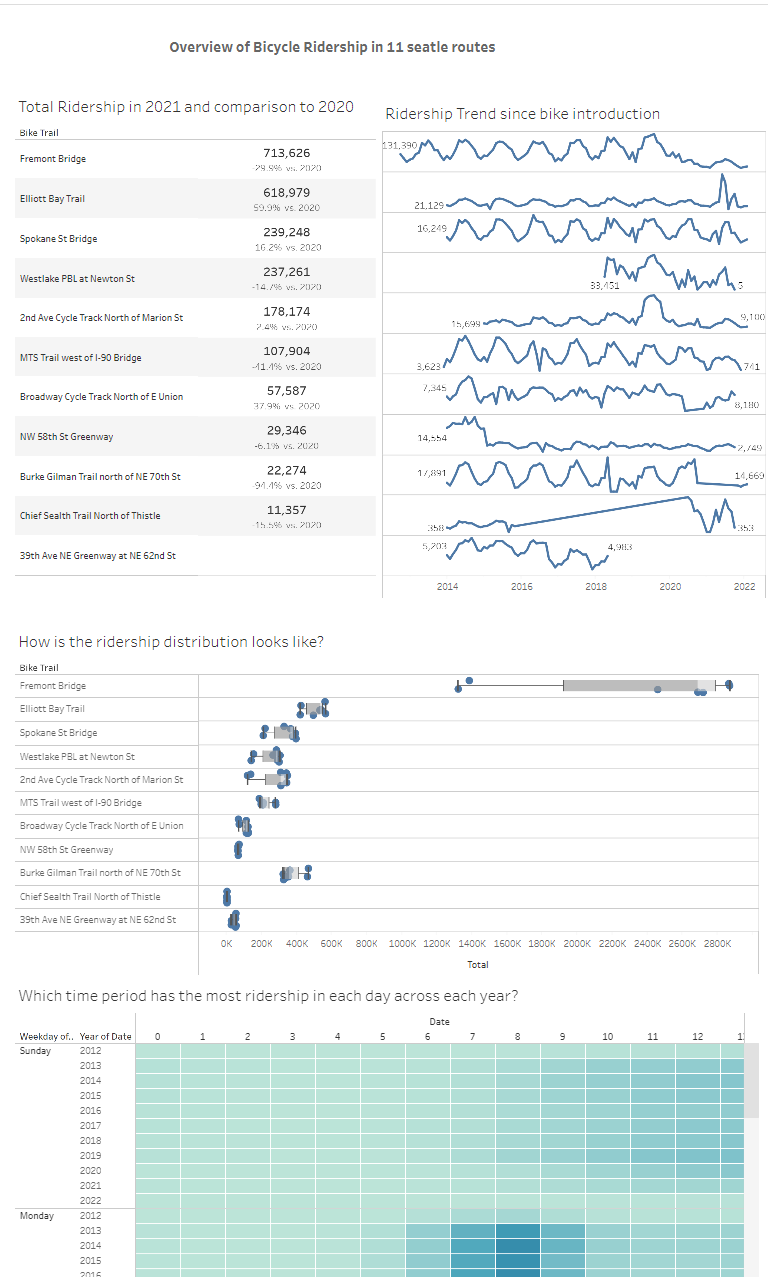
In the third day of dashboard week, we are tasked to analysis the bicycle ridership data in Seattle. The data is taken from Seattle Open Data Portal and we are supposed to analyse the data of 12 cycle routes.
After examining the dataset, I discovered that the data structure is slightly different from one another as the columns name are different and some data have more columns than the other, so I think it is easier to handle the prep using Tableau Prep by using the wildcard union and then using the manual grouping feature in Prep to group the similar columns (which named differently) together.
After that I just need to pivot back the data to get the total ridership value from the dataset by summarizing the columns of each location (east, west, north, south).

The main challenge is to build a dashboard using the Tableau Public WebEdit and finding a solid story to tell. I did an initial exploration with the data I cleaned and found that most ridership happens during weekday and peaked slightly before office hour starts and slightly after office hour ends.
This means that most likely the riders were commuting for going to the office only. So it is not surprisingly, the ridership for most cycle routes have a big drop during pandemic
There are quite a number of limitations in webedit and I found out that we can't simply input the shape file to the server. I've decided to abandon my plan to do spatial analysis and just put whatever I came up with and start building my dashboard in the webedit.

In the end, this is what I came up with for today's task.

