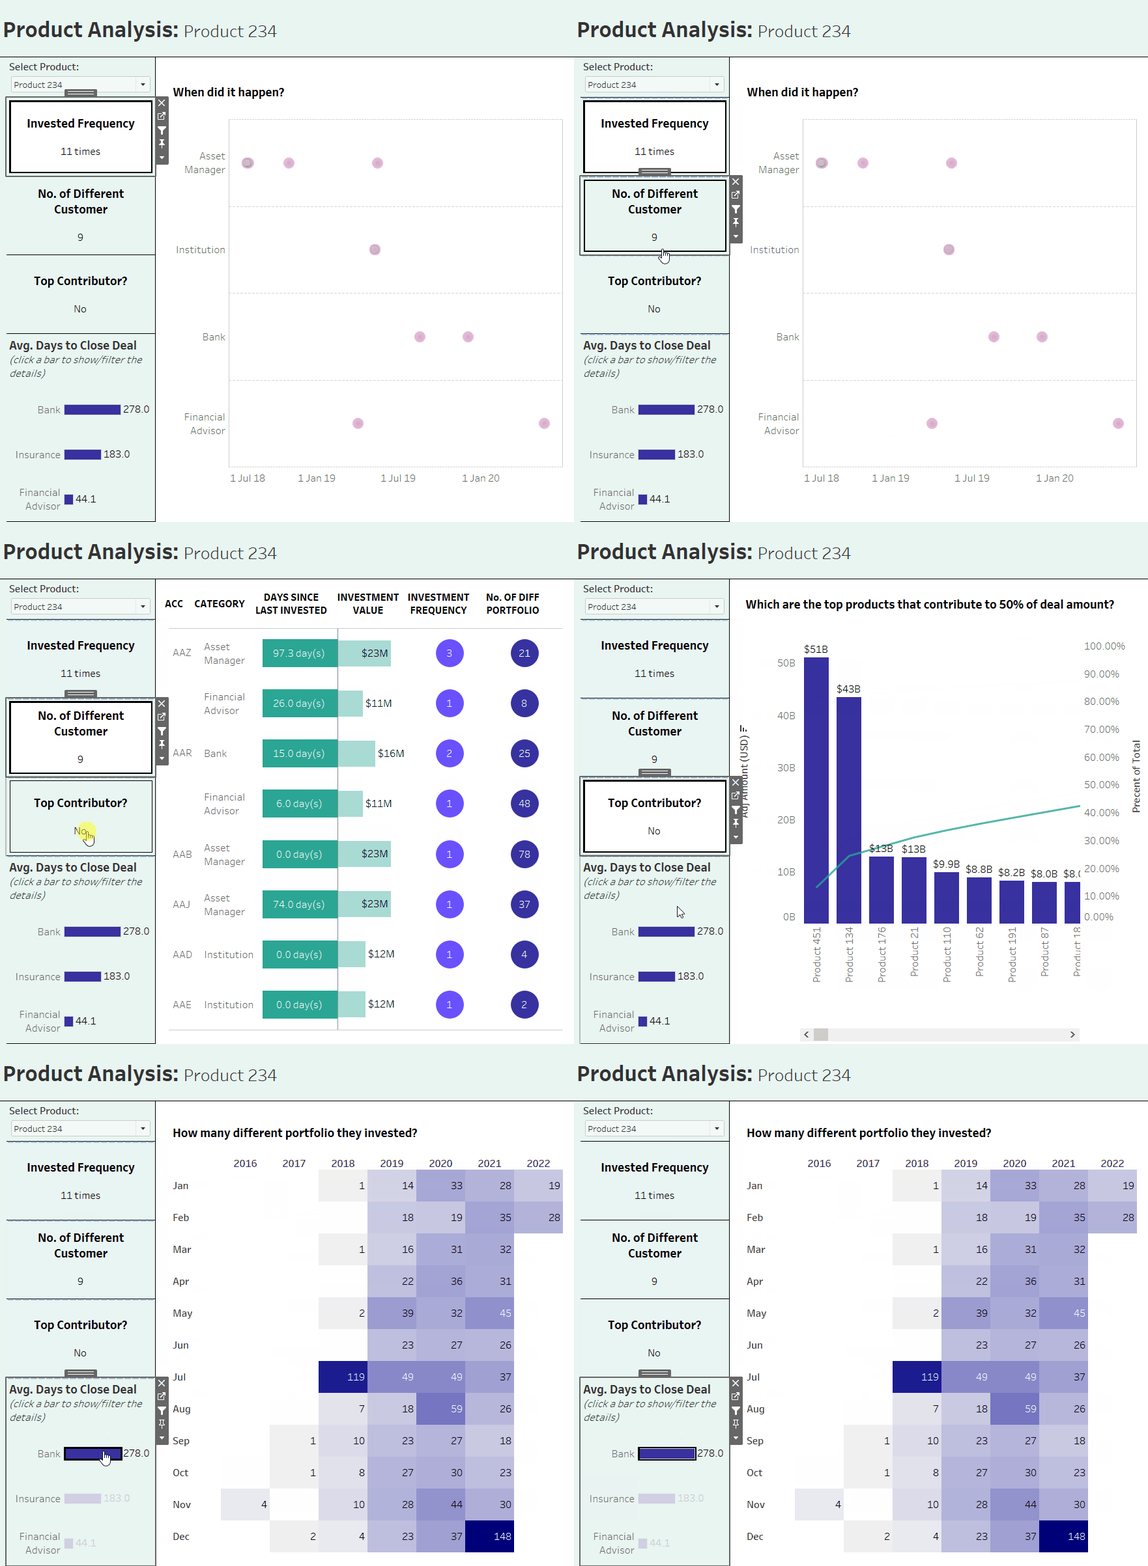
Sometimes when we are constrained to have a "one page" corporate dashboard, swapping out different sheets using parameters is an effective way to save space in your dashboard. Another good reason to do this is if you want to add additional information/analysis to the KPIs/BANs in your dashboard. In this blog, using a dashboard I designed for a client project, I will show you how to switch to another chart when the user clicks on a KPI chart.
Conventionally, we can use a parameter to swap a simple chart, as described in Henry's blog. Using the same concept, I take it a step further by using the parameter action in the dashboard action to control the changes to the parameter instead of using the parameter interface itself.
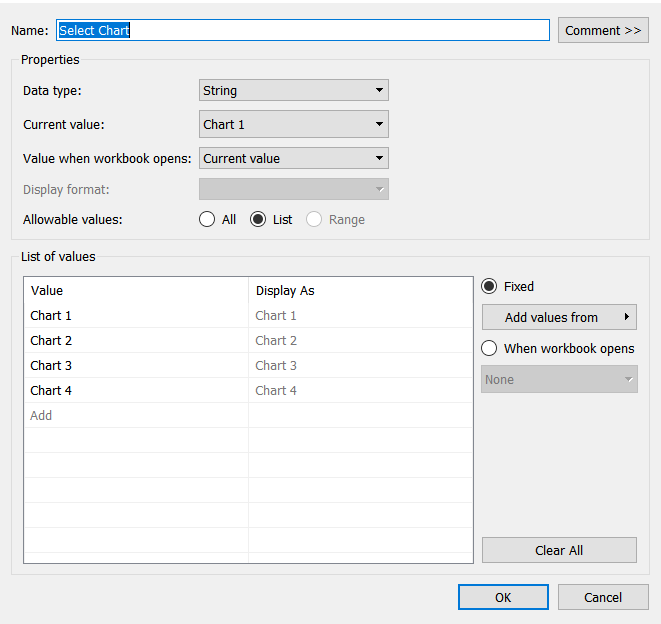
STEP 1: Create a parameter (named as Select Chart)
In this case, clicking on one of the 4 KPI charts will display another chart containing further analysis associated with the KPI. So I created 4 fields for the parameter as shown below:
STEP 2: Create a calculated field that uses the parameter
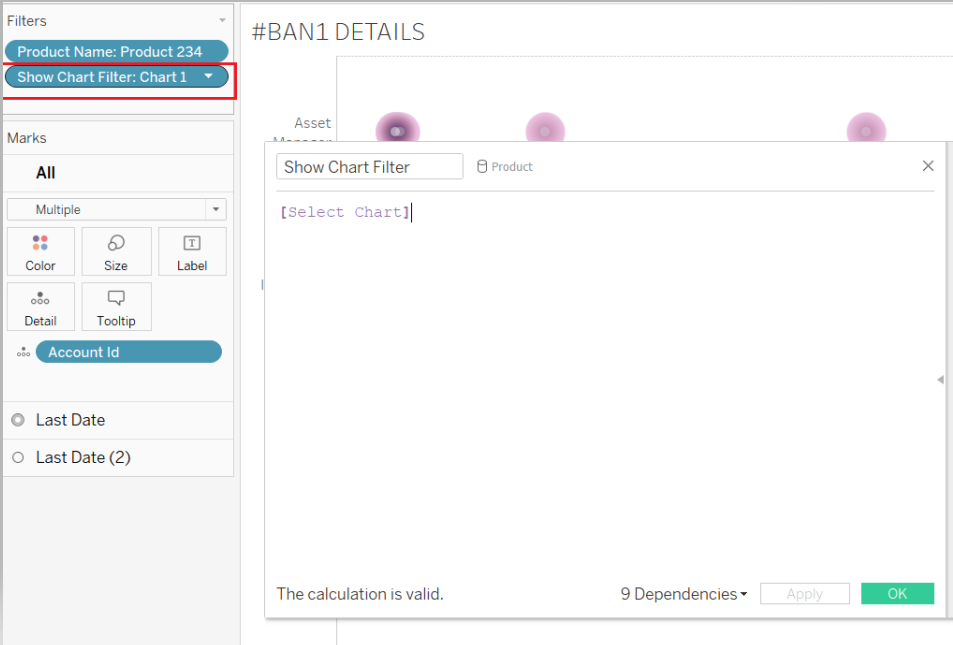
STEP 3: Use the calculated field, in this case, we drop the field to the filters
For the remaining 3 sheets, I need to repeat step 3, but change the parameter option individually and select Chart 2, Chart 3 and Chart 4 respectively.
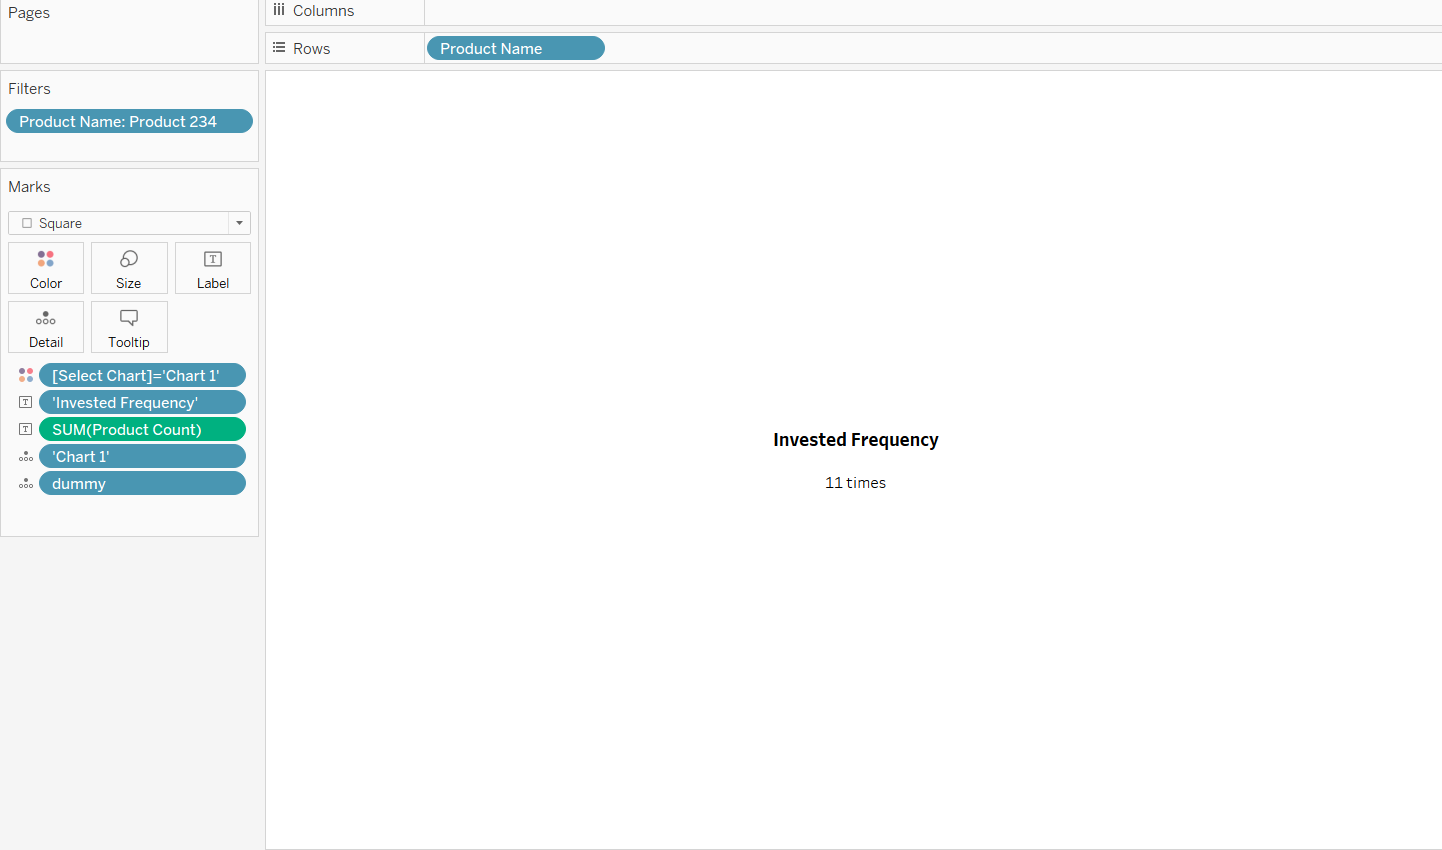
STEP 4: Put an ad hoc calculation that contain string of 'Chart 1' to Detail mark card for the first KPI sheet, repeat for the remaining sheets and labelled then 'Chart 2/3/4' accordingly.
NOTE: This will be used as the source field in the parameter action, essentially we are sort of 'assigning' these values to the parameter "Select Chart" that created earlier.
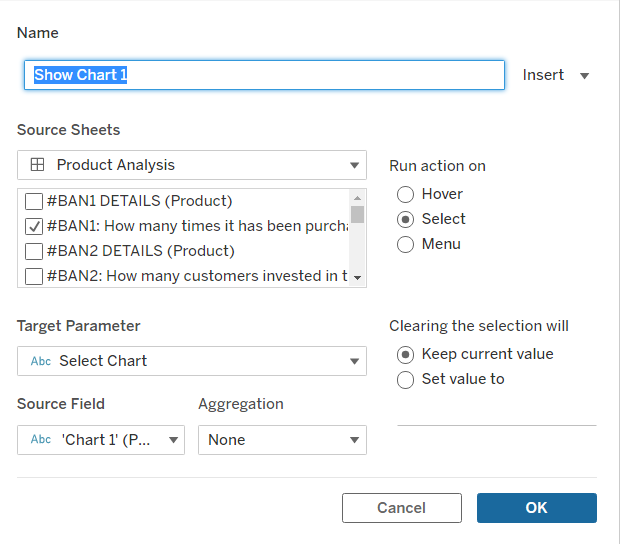
STEP 5: Setup the parameter action in the dashboard action. (There are 4 of them in this example). I will only explain the setup for the first one. Select the first KPI sheet as the source sheet and choose Run action on "Select". This means that the parameter will be changed when the user selects the first KPI sheet. The target parameter should be the "Select Chart" parameter that we have set up to change 4 sheets. The source field is the "Chart 1" field in the details of the first KPI sheet. We don't need to aggregate anything and when the user deselects, we should leave things as they are, so we select "Keep current value".
STEP 6: Drop all the sheets inside a vertical container in your dashboard and hide the titles.
Now, your 4 charts have no titles but ideally we want to have 4 different titles for all 4 charts, therefore we need to create 4 separate sheets as titles for each of the charts. Apply the same step for the title sheets. We need to drop all of them into a horizontal container and hide the titles of all the "titles" sheet.
There you have it. These are the basic 6 steps to change the sheets when the user clicks on some KPI sheets.
