Our task today is to design a dashboard that incorporates a universal design and must be accessible to all. Ideally, we need to make a dashboard that can be navigated using keyboard. The dataset given is from a Glasgow City Council report in FixMyStreet.com. It contains two types of road problems: pavements and potholes that need to be fixed by the city council.
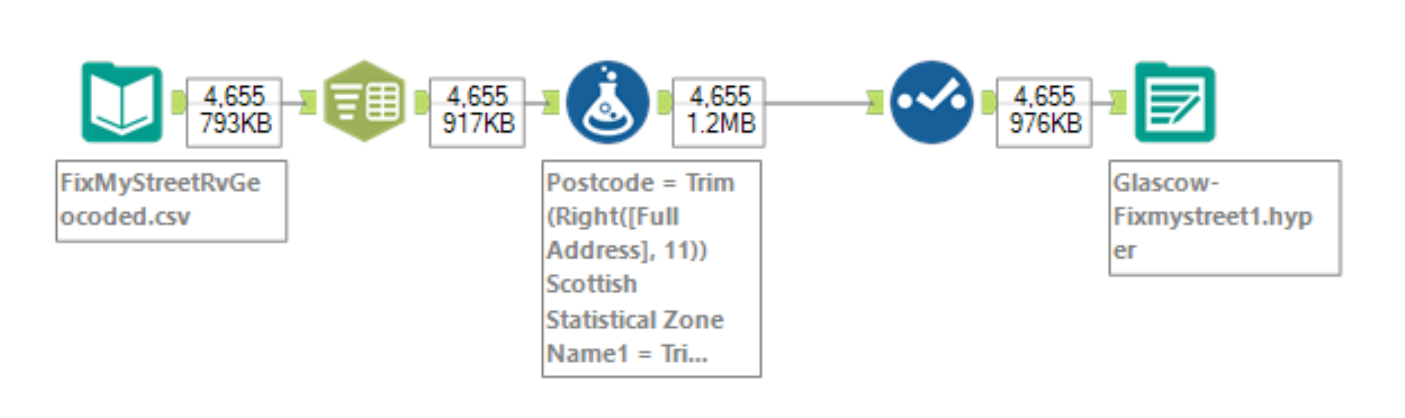
Data is pretty straightforward and not much cleansing is required. I just extracted the postcode from the full address field and the Zone Name from the Full Zone Label in Alteryx. I just need a very simple workflow to achieve that.
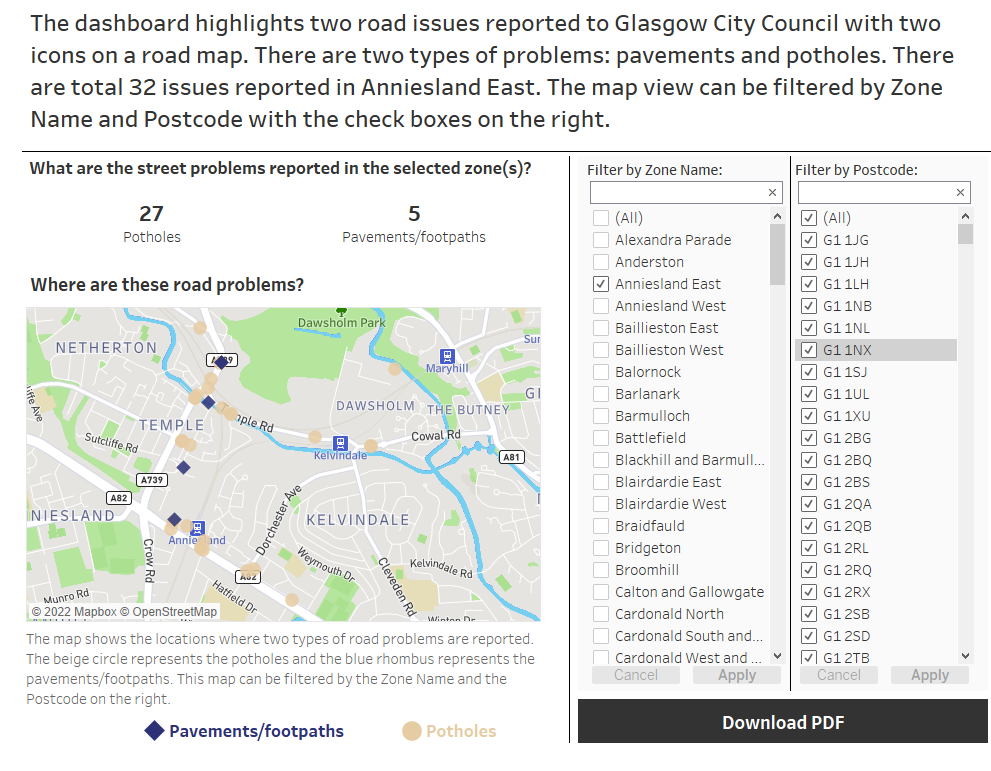
One of the criteria for the design is to allow the users understand the content without looking at the visualization. This means that I have to highlight the key messages of the visualization in the title or the caption of the graph. I also activate the "Show Apply Button" option in the filters in order to facilitate users who navigate the dashboard using keyboard.
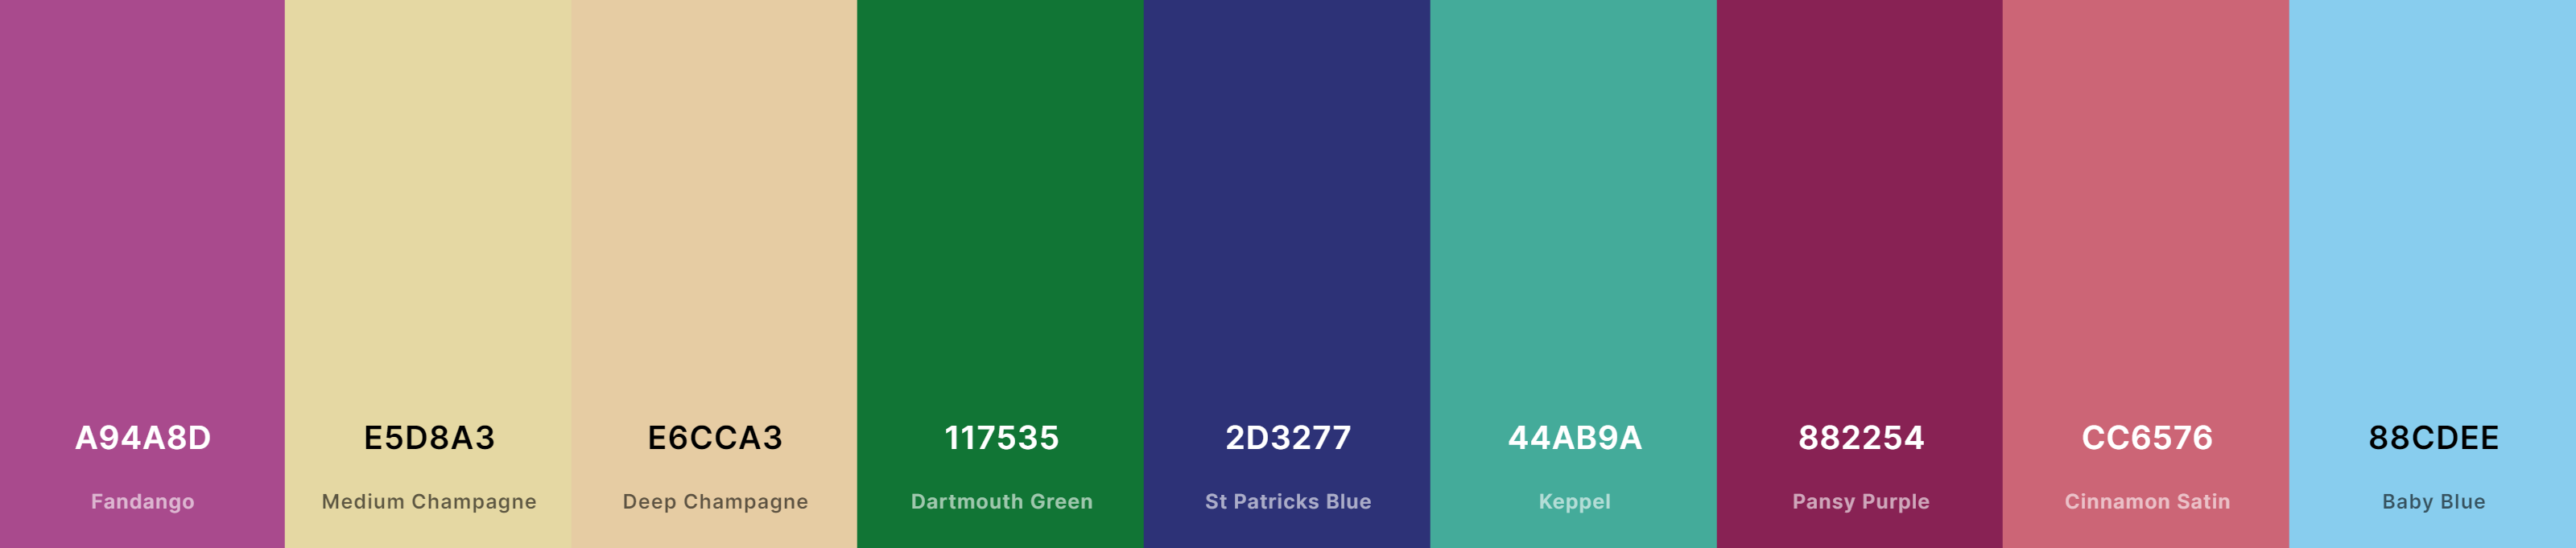
In terms of colour, I found a colour-blindness friendly palette from this website and I built it in Coolors.com. I decided to use two different shapes to display the two different road problems on the map in order to make them more distinguishable. Using the colour contrast checker I ensure that the two colours I choose have good contrast rating.
I designed the layout so that it can be used for Tablet as well and I also decided not to use tooltips or interactivity in this dashboard, as it may be difficult or inaccessible for some users. I used a road map as a background because I thought it would help the public see where these road problems actually are, as these landmarks should be easier to see. However, I faced another challenge where the map became a bit busy and the colour of the two symbols for the two road problems became less contrasting. I didn't have much time to look for another colour-blindness friendly colour palette so I just left it as it is.
In the end, this is what I have managed in 3 hours: