So you’re looking at a bar chart and want to filter out everything apart from the Top 10 items, by sales for example. You then want to see the top 10 items for a for a particular region, so you apply a region filter. You expect to see ten items each with a corresponding bar. But wait…why are there not ten bars?! Well, if you’ve asked yourself this question, this blog aims to answer this exactly!
Adding to Context
Put simply, the answer to our question is adding the filter to context. However, this answer is best seen visually. So the example I will use to demonstrate this will be a bar chart using the data that ships with Tableau: Super Store data. Creating the chart below by dragging ‘Product Name’ to the filter, right-clicking on it and selecting ‘Edit filter’, navigating to the ‘Top’ tab and selecting top 10 by sales. We have 10 bars, as expected. (In the image below, the top 10 filter has already been applied (the Filter box is just there to show you where to select the Top 10 by sales).

Now lets see the top 10 sales for a particular region. Again, dragging Region to the filters shelf and selecting a region (in this example we’ll use West) and applying it, we find there are only 6 products displaying as seen below.

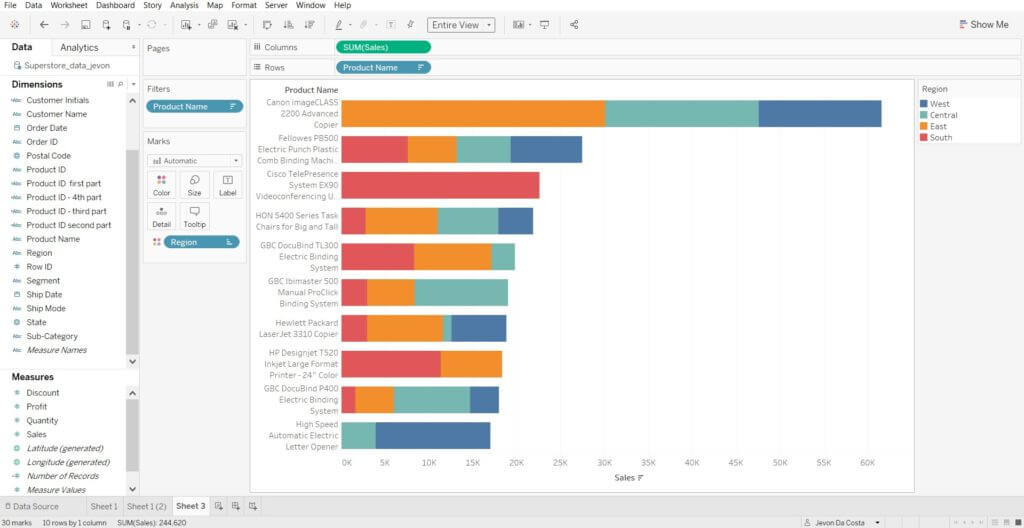
Now the reason for this is the way Tableau sees the order of filtering. Tableau first calculates the top ten sales regardless of the region filter and from that, the top 10 sales of a particular region are calculated. It makes more sense looking at the chart below. Taking away the region filter and adding it to the colour palate, you can count only six blue (West) products out of the ten products. This is why we end up with six products in the bar chart above. If we were to filter the South(red) region, we would end up with eight products. This is also the case for the two remaining regions.

To get the top ten products we wanted in the first place we simply just need to right click on the Region pill on the filter shelf and select ‘Add to Context.’ And voila, the top 10 products by sales in the West! The Region pill in the filter shelf will now be coloured a light grey to indicate it’s been added to context, as shown below.

So a general rule: if you’re wanting to look at the Top/Bottom items where filters are present, make sure the filters have been added to context!
Hope this has helped Tableau users when using this kind of setup, let me know if this has by contacting me on Twitter @Jevon_DaCosta or LinkedIn !
