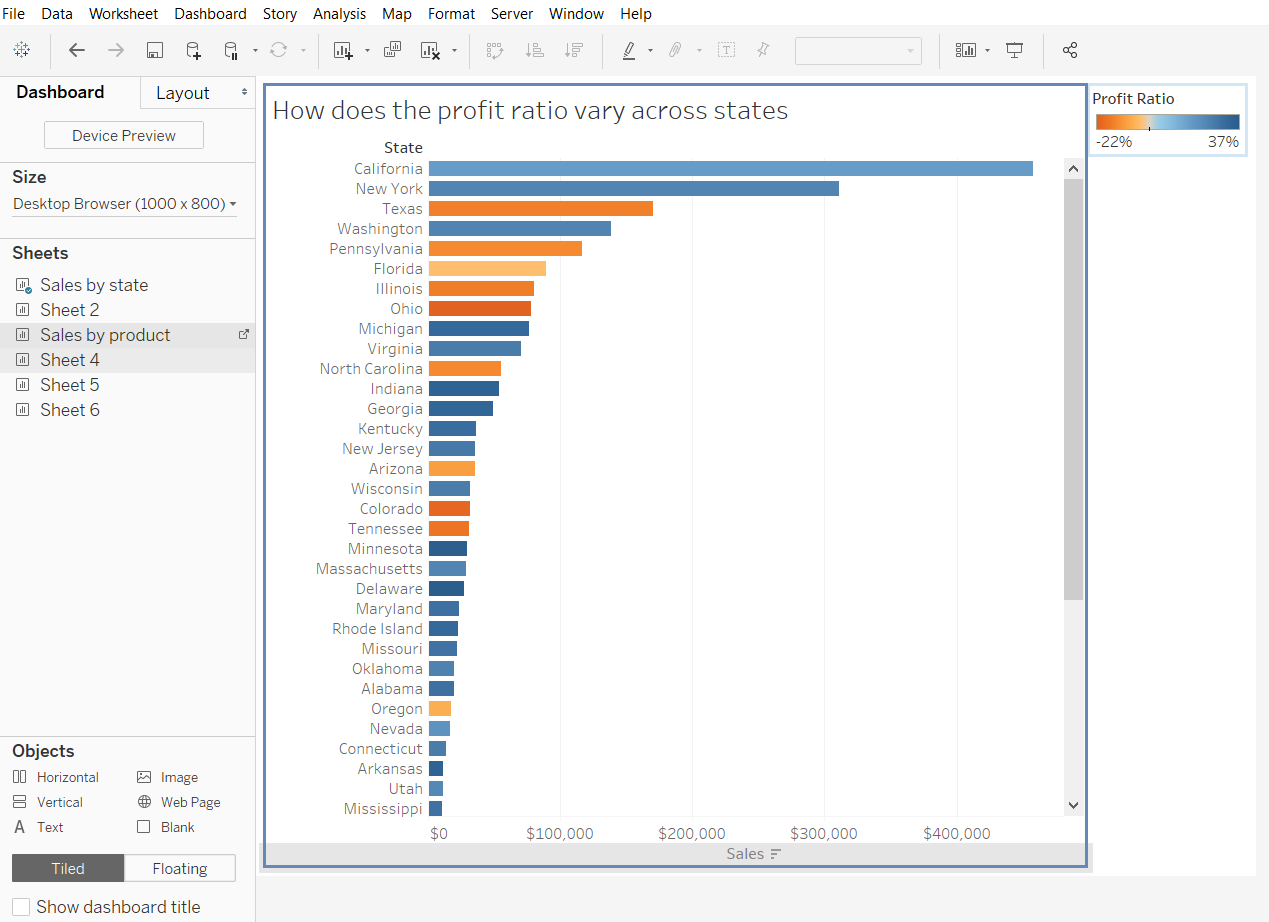
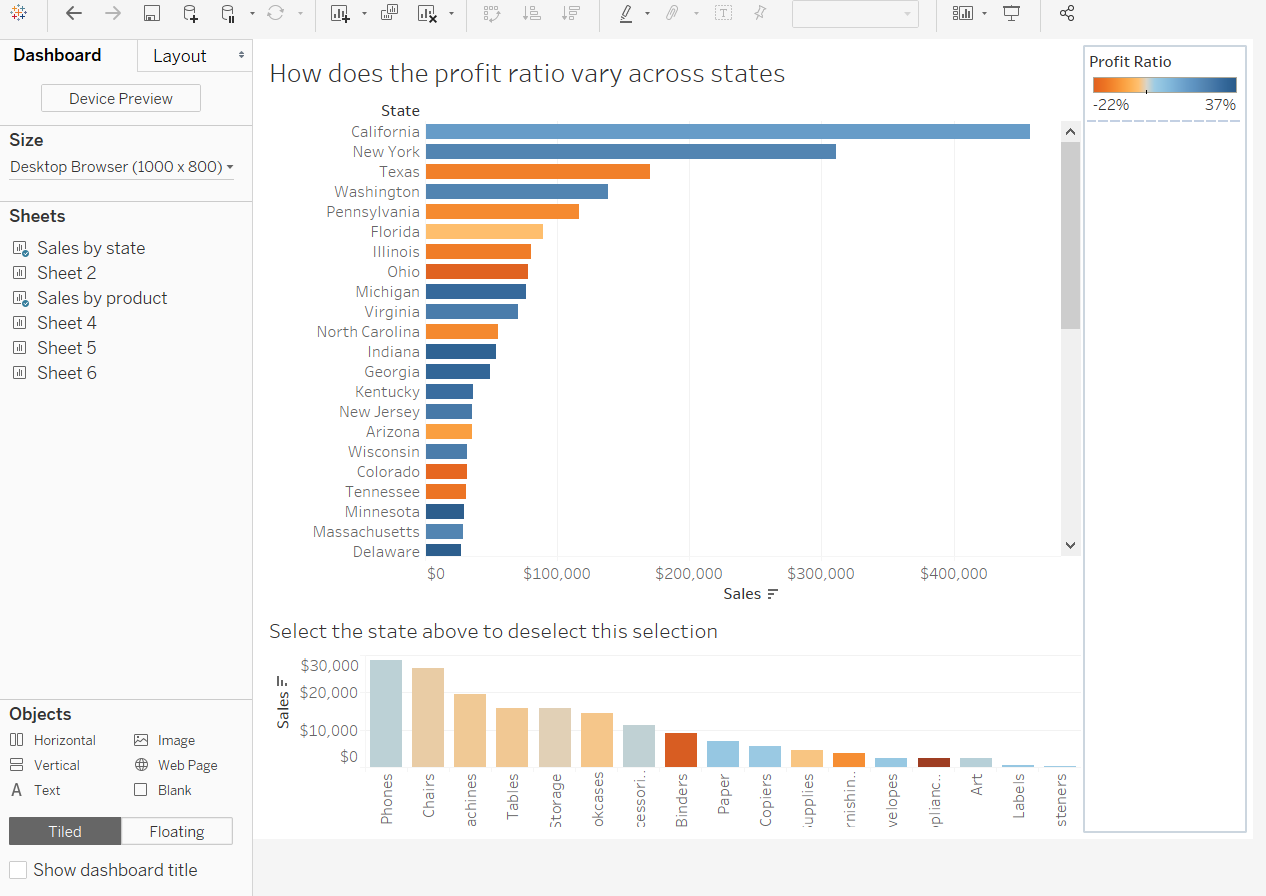
There might be a time where you would’ve liked to have seen a dashboard where selecting a part of chart will cause another chart to pop up, and deselecting that part will hide the pop up chart, sort of like in this example:

There a few steps to achieve such a dashboard, so this this blog will explain these.
In this example we will use two charts from Sample Superstore data, the Sales by State which we will use as the filter and the Sales by Product (and state) which will pop up depending on whether a state was selected.
Step 1. Drag a vertical container to the dashboard.
Starting with an empty dashboard, drag a vertical container (or a horizontal if you want the charts to be placed side by side as opposed to below or above) to the dashboard.
Step 2. Insert the sheets
Insert the Sales by state sheet in the container we just created. Next, drag the second sheet to the bottom of the first sheet. You should see the bottom grey out just like in the picture below.

At this point the dashboard looks like this:

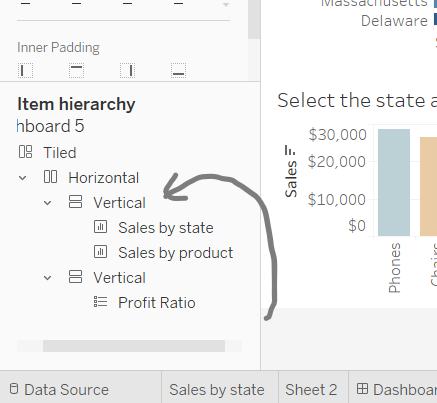
To make sure both sheets are in the same container we can check the Item hierarchy. Under the Layout tab on the left hand side you should find it at the bottom. Inserting both sheets in the same container gives the pop up chart effect, in this case both are inside a vertical container. It should look like this:

Step 3. Dashboard actions
Select the Dashboard tab at the top of window, select Actions. Add an action filter and configure the window so it looks like this.

Effectively you want the bars on the Sales by state sheet to hide/show the Sales by product. So the source sheet will be the Sales by state and the target sheet will be the Sales by product. Make sure the Run action is on ‘Select’ and under the ‘Clearing the Selection will:’ select ‘Exclude all values’. This will cause the sheet to hide once a bar has been deselected.
And there you have it, a dashboard which will behave like the one shown in the gif above!
Get in contact with me if you wish to via my twitter or Linkedin
