Content:
- Sets vs Groups
- Manual vs Computed Sets
- Combined Sets
- 'Add to context' filters for sets
- Quadrant Charts
Sets vs Groups
Sets are custom fields that are created within Tableau Desktop based on dimensions from your data source. Sets can be created manually or computed (based on conditions). Within sets, data is either IN or OUT the set.
Groups differ since these simplify large numbers of dimension members by combining them into higher-level categories. Groups create a new field that can be used to categorize values in that dimension or even create another level in a hierarchy.
Manual vs Computed Sets
Manual Sets
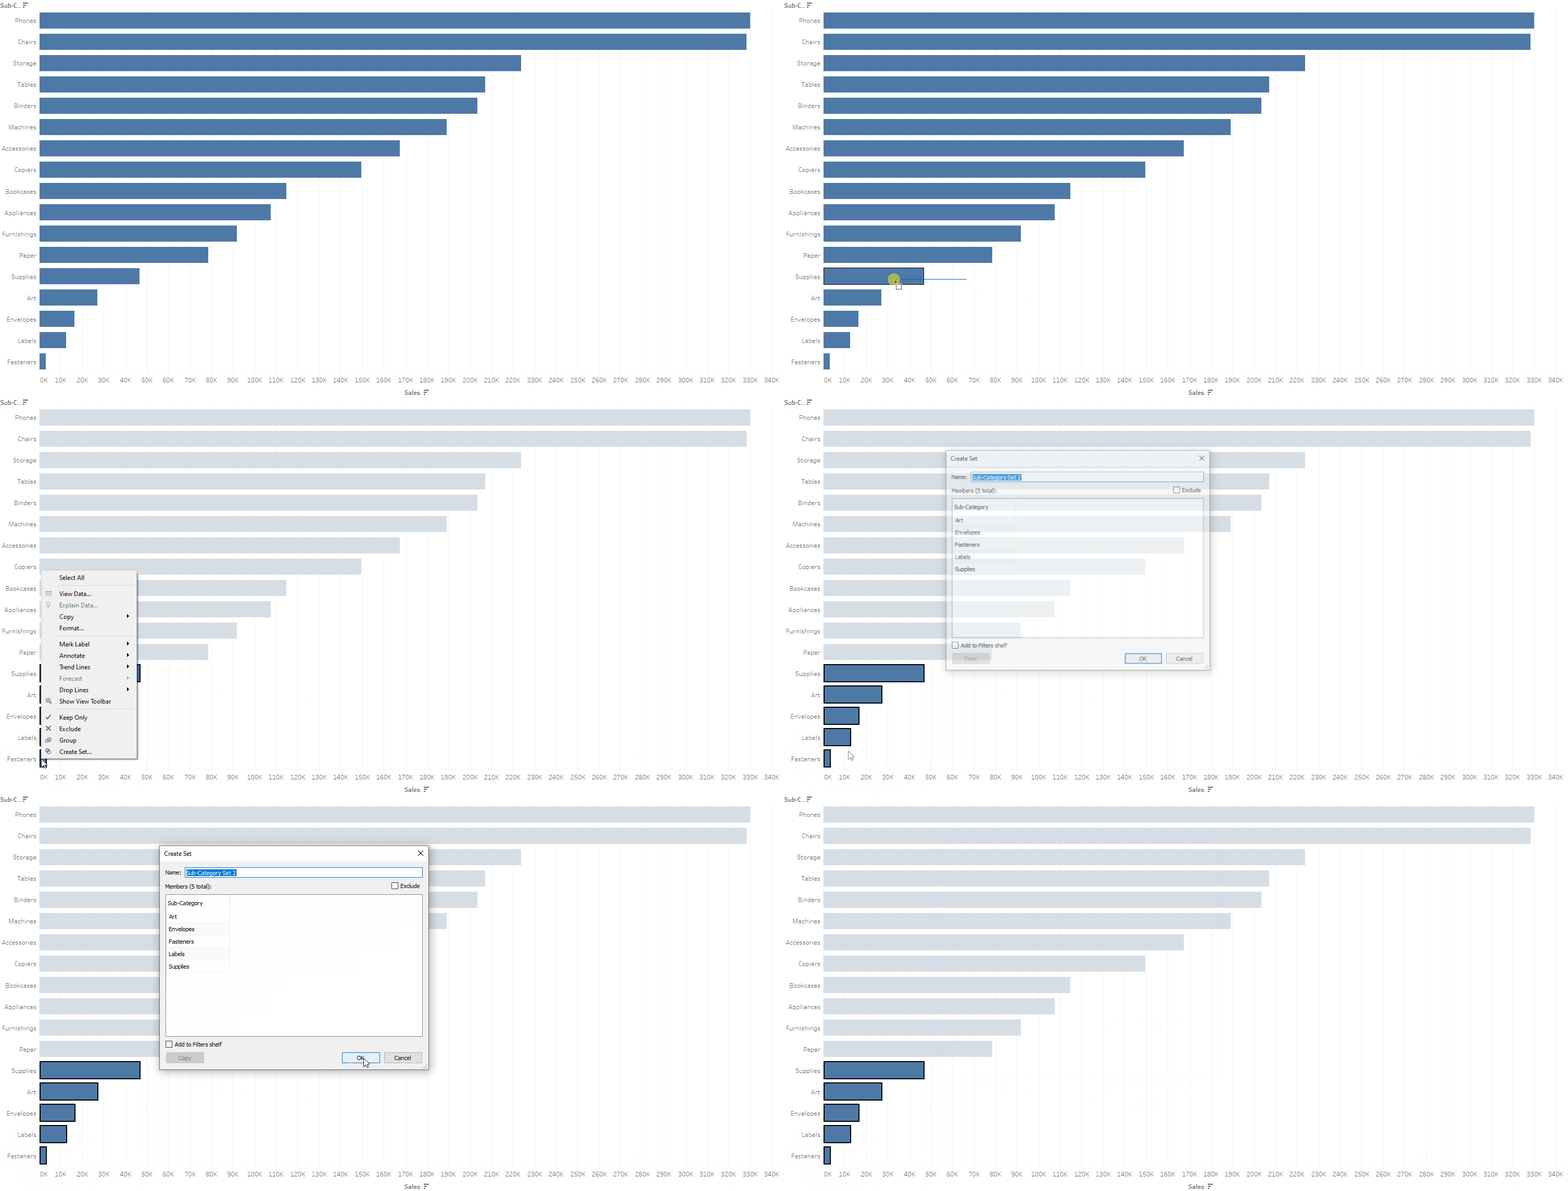
To create manual set simply:
1. Select the data or data objects (bar, dots, lines, etc.) that you would like to include in a set.
2. Right-click and select 'Create Set'.
3. Don't forget to name your set.
Alternatively, you can choose the field or dimension for which you would like to create the set from (e.g. subcategories), right click > Create > Set, and then select the values manually.
Computed Sets
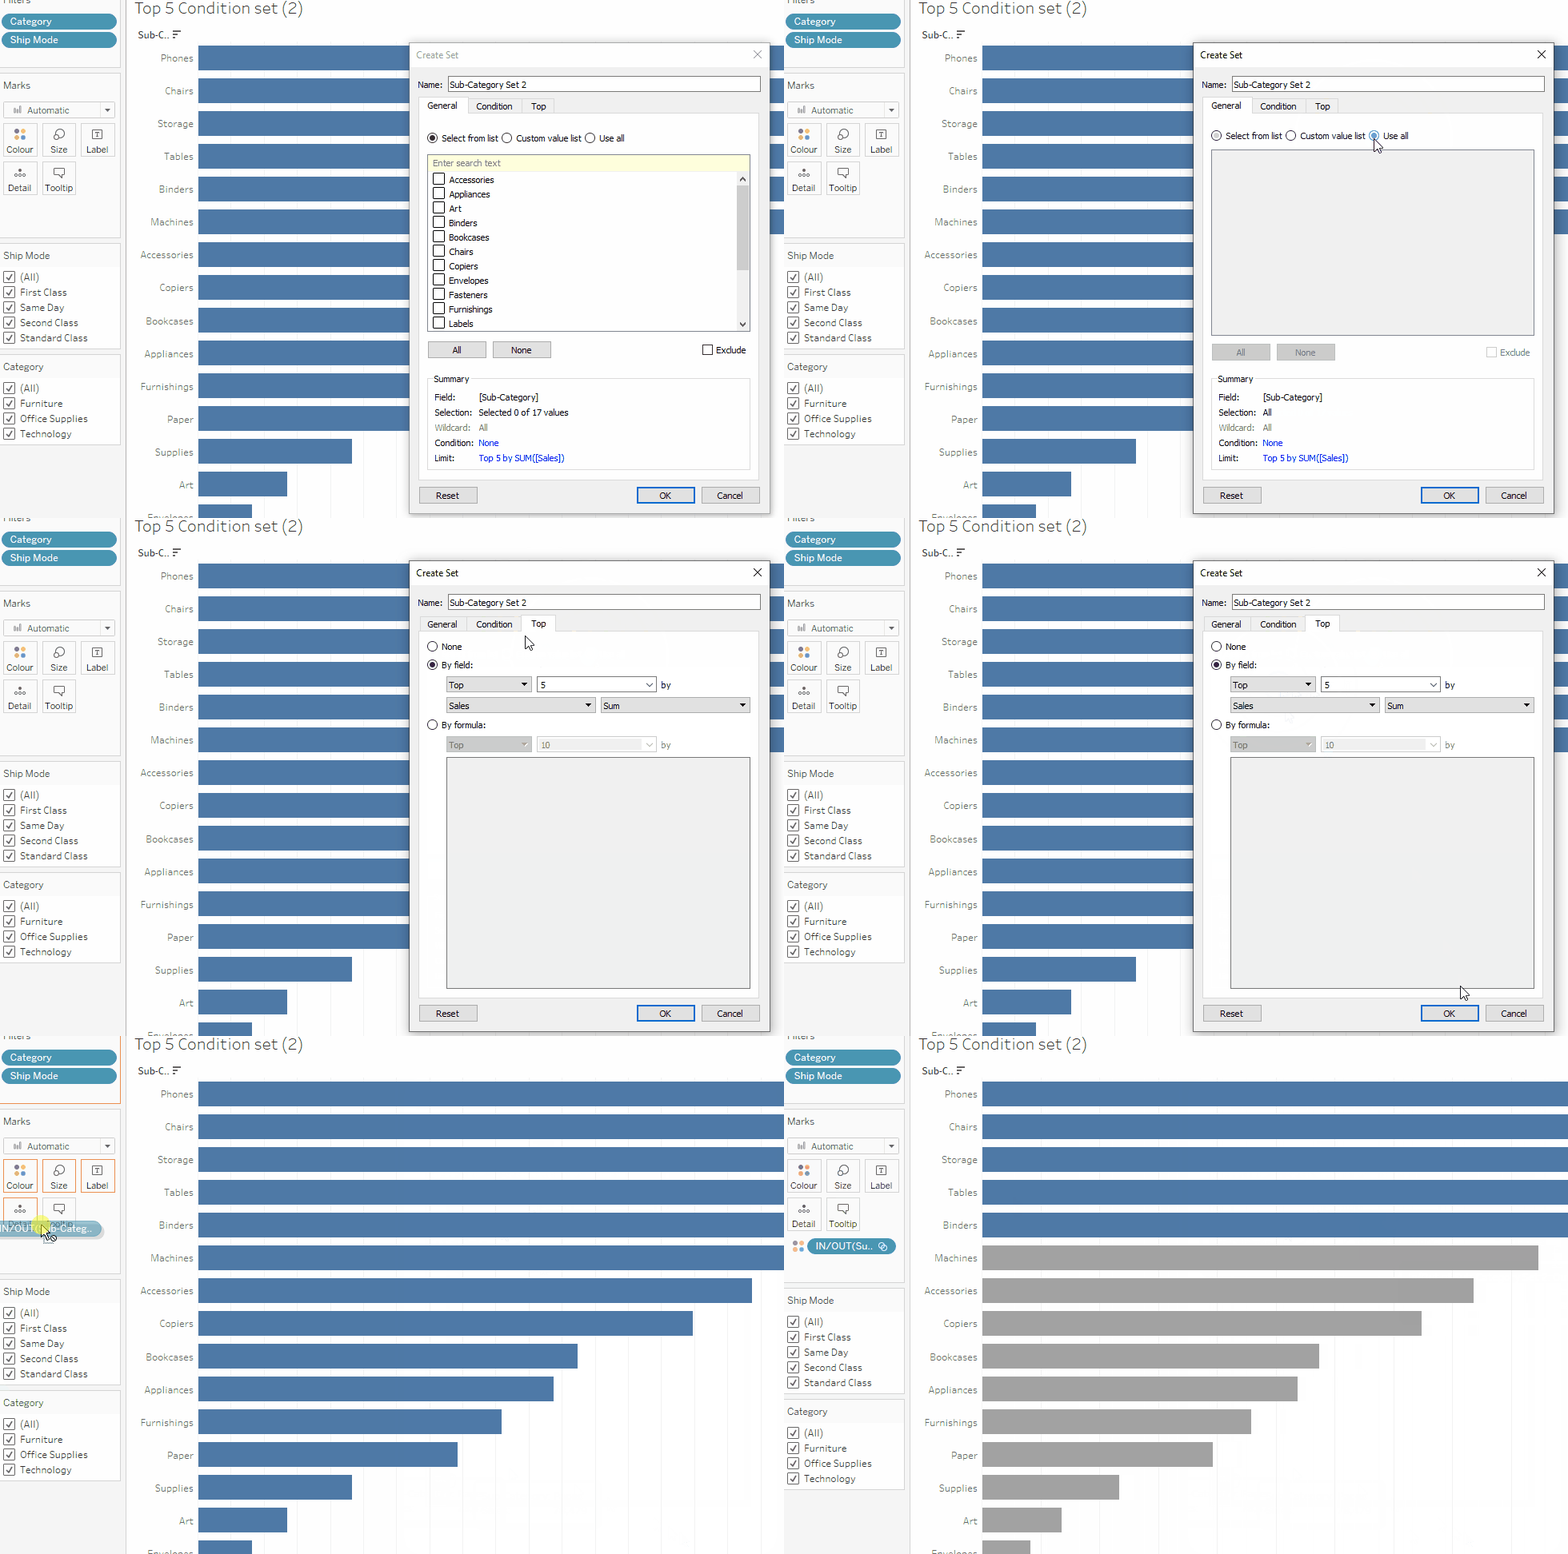
To create a computed set simply:
1. Right click on the field (e.g. sub-category) that you would like to create the set from.
2. Select 'Create > Set' to open the create set dialog.
3. Select 'Use all' from the General tab and create your condition in either the 'Condition' or 'Top' tabs (in this case, top 5 by Sum of Sales).
4. Use your set to highlight data IN and OUT of your set by dragging your set to colours (you can also use it as a filter).
Note: This example creates a set for the Top 5 Sub-categories by Sum of Sales. If we add a filter (e.g. Same day ship mode) and use it to filter our data, it will still show the Top 5 Sub-categories by Sum of Sales rather than Top 5 Sub-categories in Same day ship mode by Sum of Sales. To fix this, we will need to add select 'Add to context' in the filter field (See below).
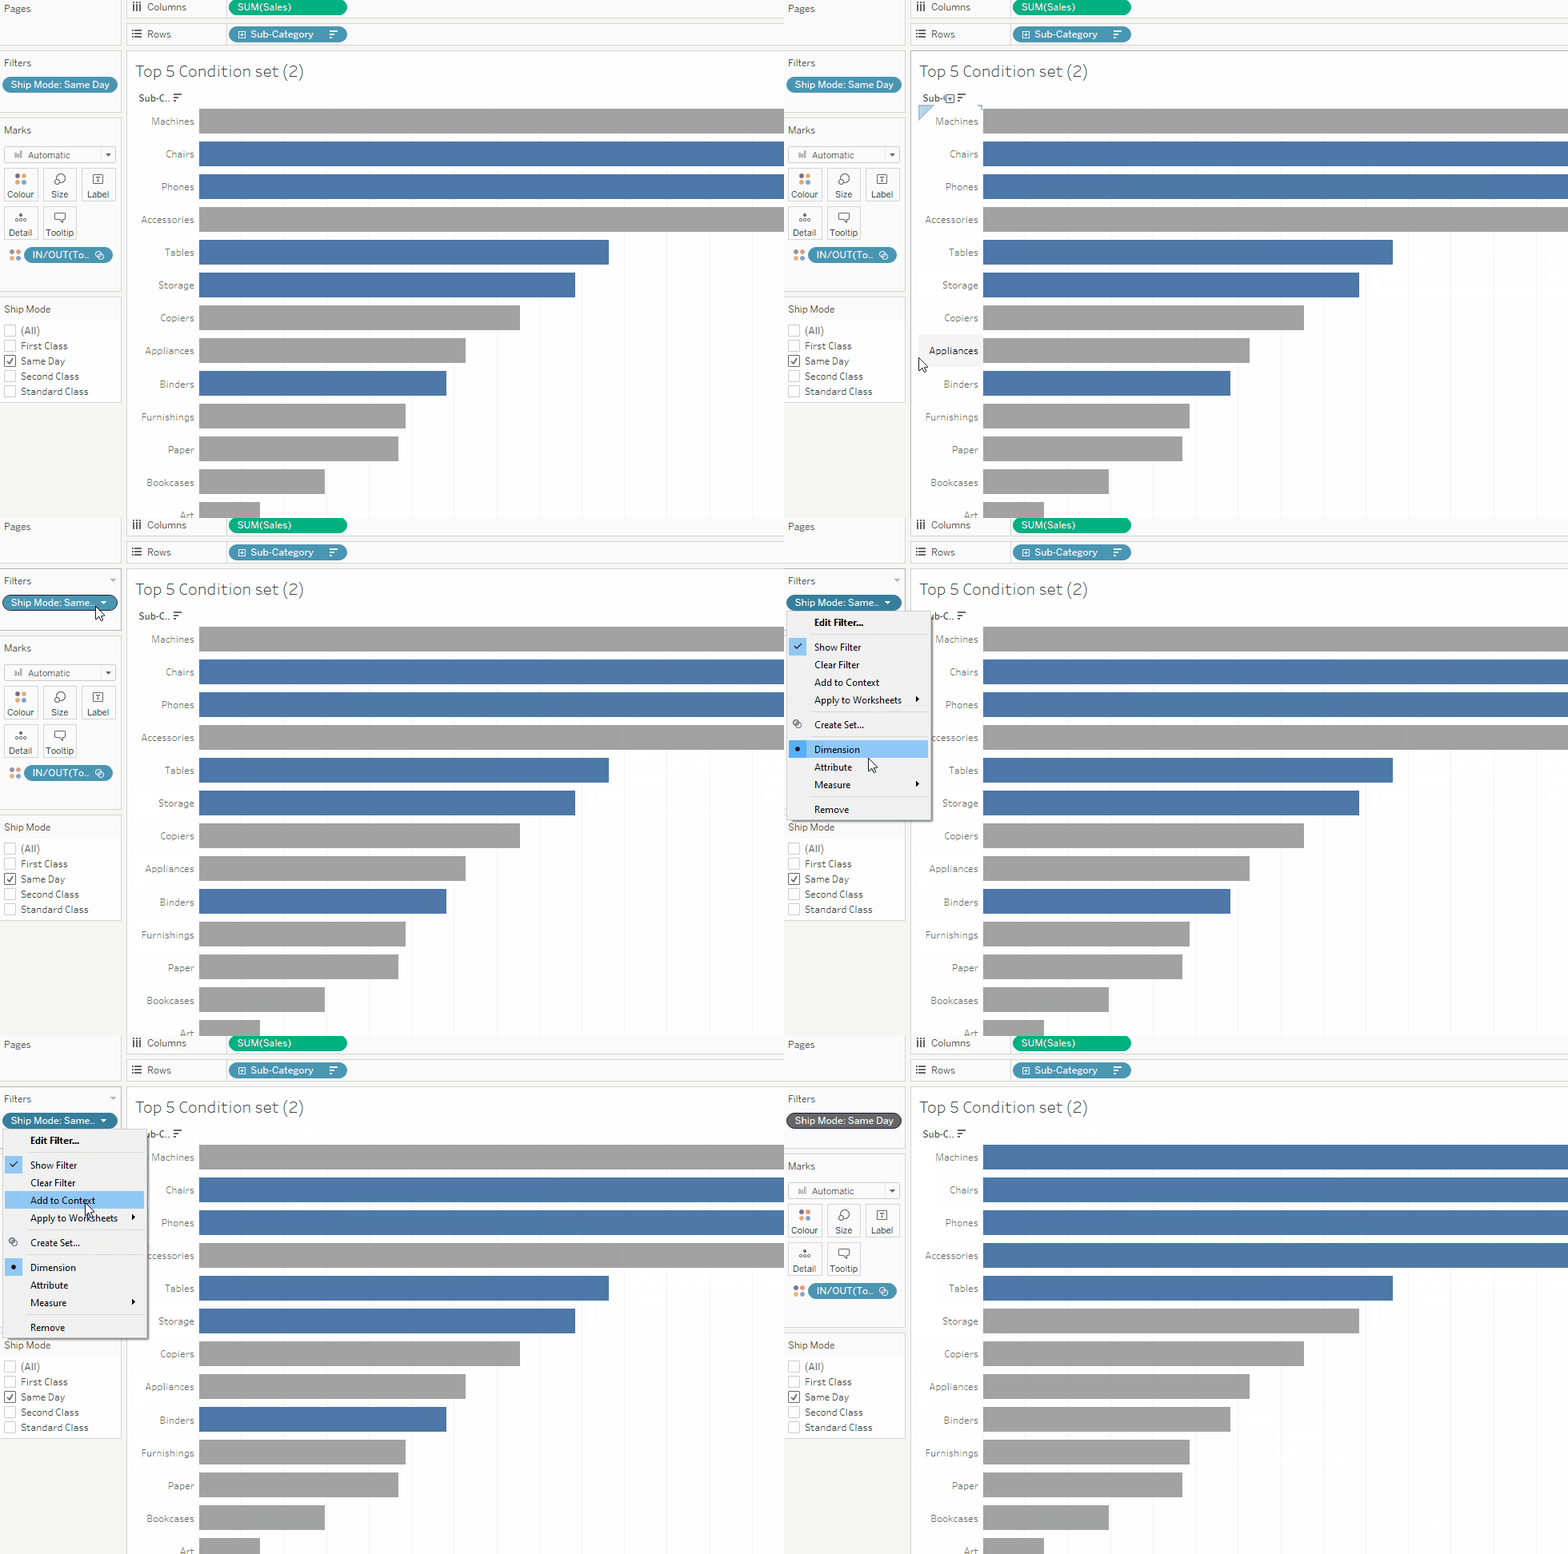
Find out more about Context Filters here: Improve View Performance with Context Filters
Combined Sets
Both manually combined sets and computed combined sets follow the same procedure to create a combined set:
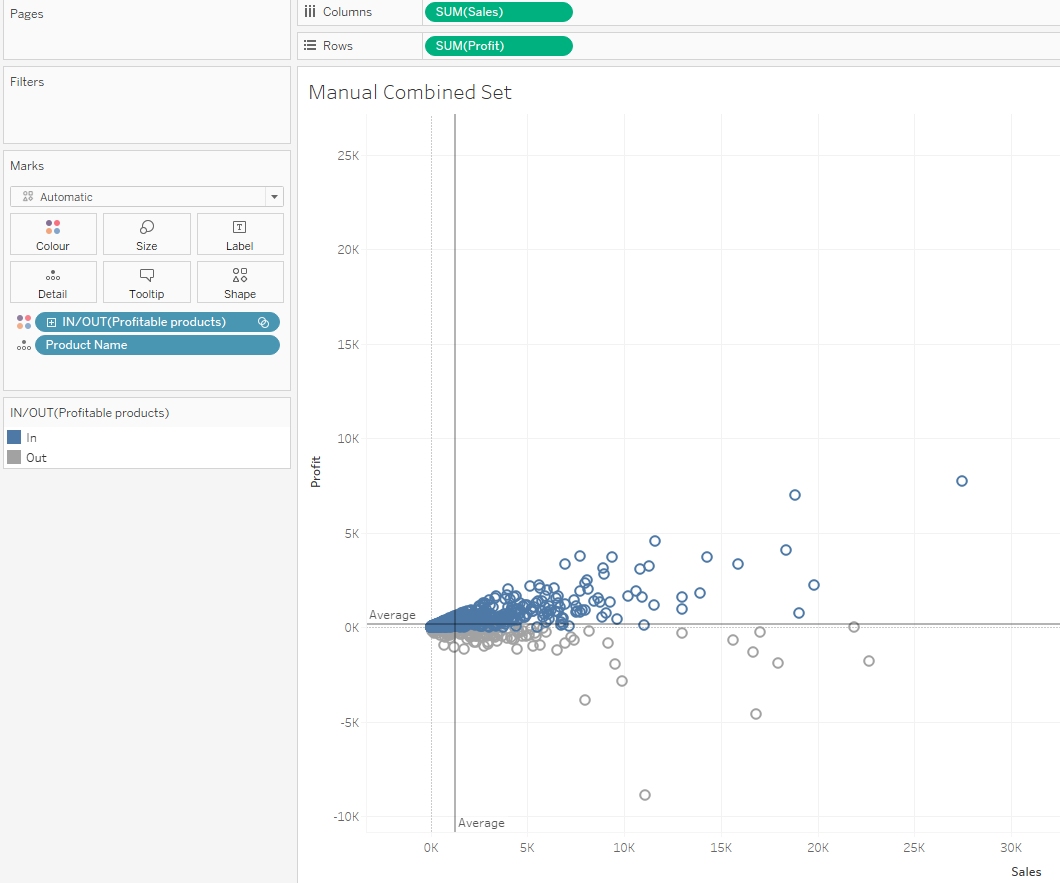
1. Manually (or conditionally) create your first set to combine (e.g. Set 1 below shows Products with profit > 0$).
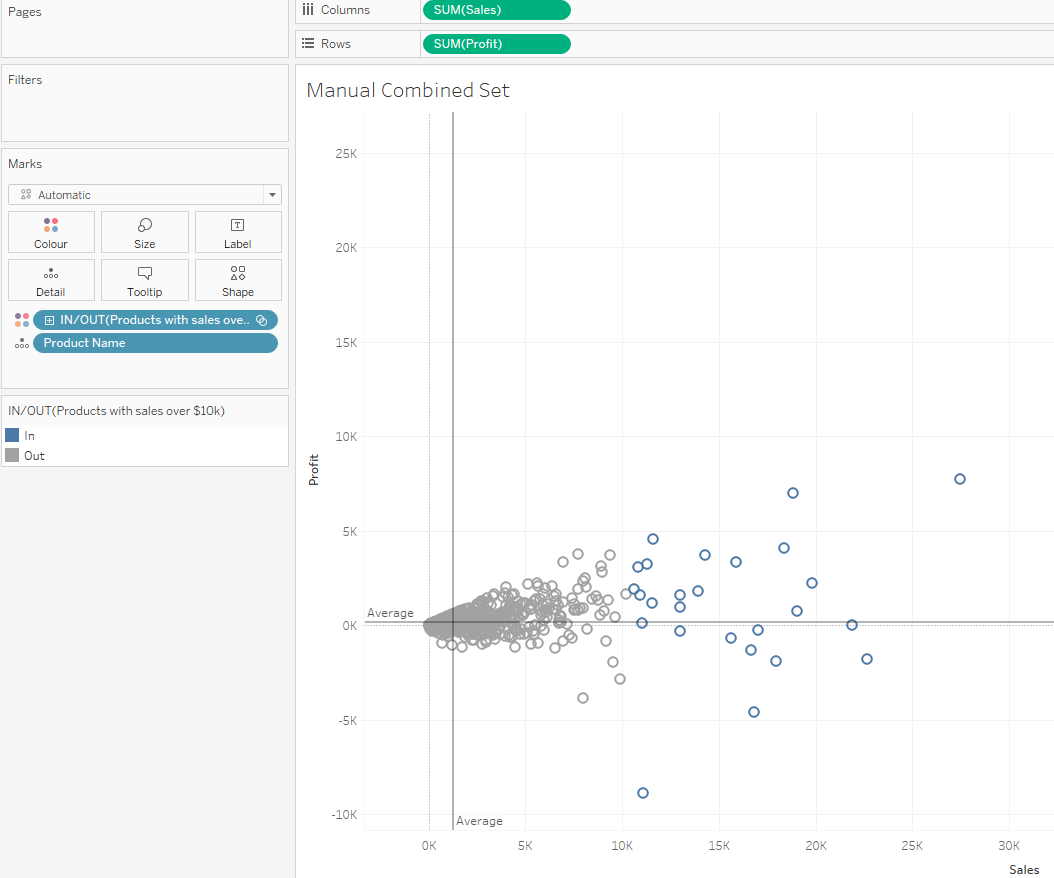
2. Manually (or conditionally) create your second set to combine (e.g. Set 2 below shows Products with sales > $10k).
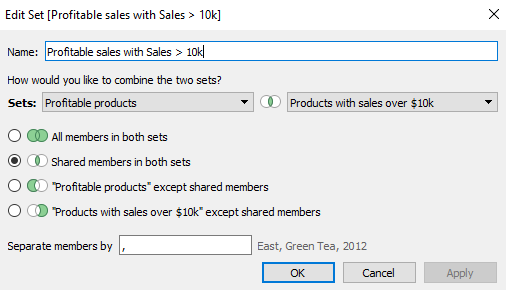
3. Create a combined set by selecting both sets (Ctrl in Windows and Cmnd in Mac + selection of one set followed by the other) > Right click > select 'Create Combined Set'.
4. Set up the combined set options. Think of it as joins where inner joins includes values that meet the same conditions IN both sets, left or right join includes values IN one set but not in the other, and full outer join which includes all values IN both sets (e.g. Combined Set figure below shows profitable Products with sales over $10k).
Set 1:
Set 2:
Combined Set Options:
Combined Set:
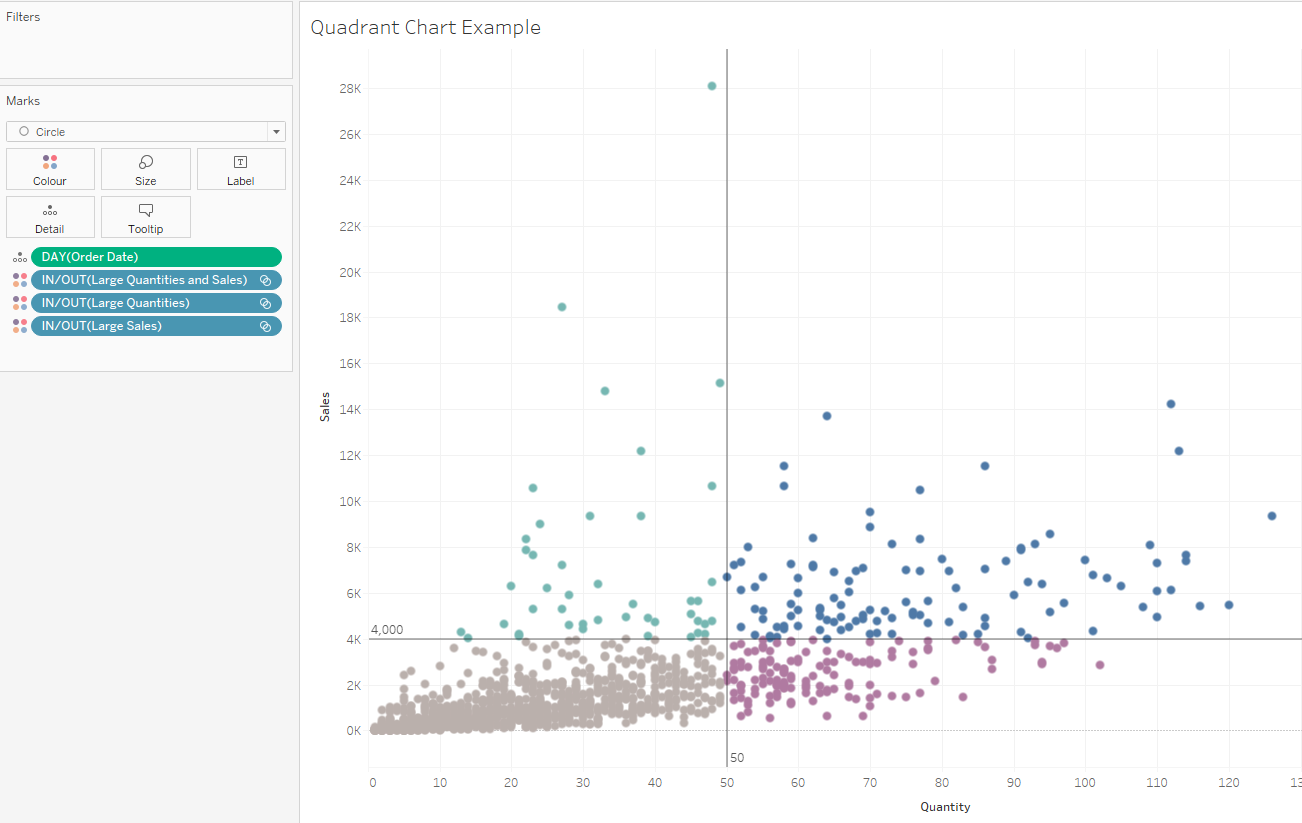
Quadrant Charts and Combined Sets on Colour
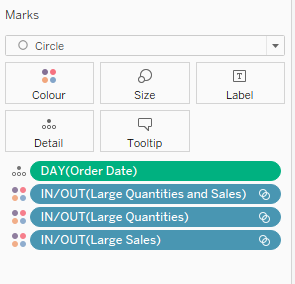
You can also place single sets and the corresponding combined set in the Colours mark to colour the data objects that meet a condition IN that particular set (see figure below). Use refence lines to create a quadrant in the chart.
References and Useful Sources
Improve View Performance with Context Filters
Tableau Deep Dive: Sets – Introduction to Sets blog by Robert Curtis

