


Grouping can be useful for simplifying complex data, creating custom categories, and improving data visualization. Grouping in Tableau can be used as part of data preparation – to group values for incorrect spellings or group members of a team together. Groups are a manual process and are based on data that are available in the data source.
Users can group data based on specific values in a field. Using the Sample - Superstore dataset*, for example, we can group sales data by region, product category, or salesperson.
*The Sample - Superstore dataset will be referenced multiple times throughout this blog to provide examples.
Visual Grouping:
- Visual grouping is a way to group data by selecting marks on a visualization.
- It does not create a new field in the data source and only groups the data temporarily, without altering the underlying data.
Example of Visual Grouping:
Highlighting the Top 10 Products by Sales
- Highlight the top 10 bars and select the paper clip
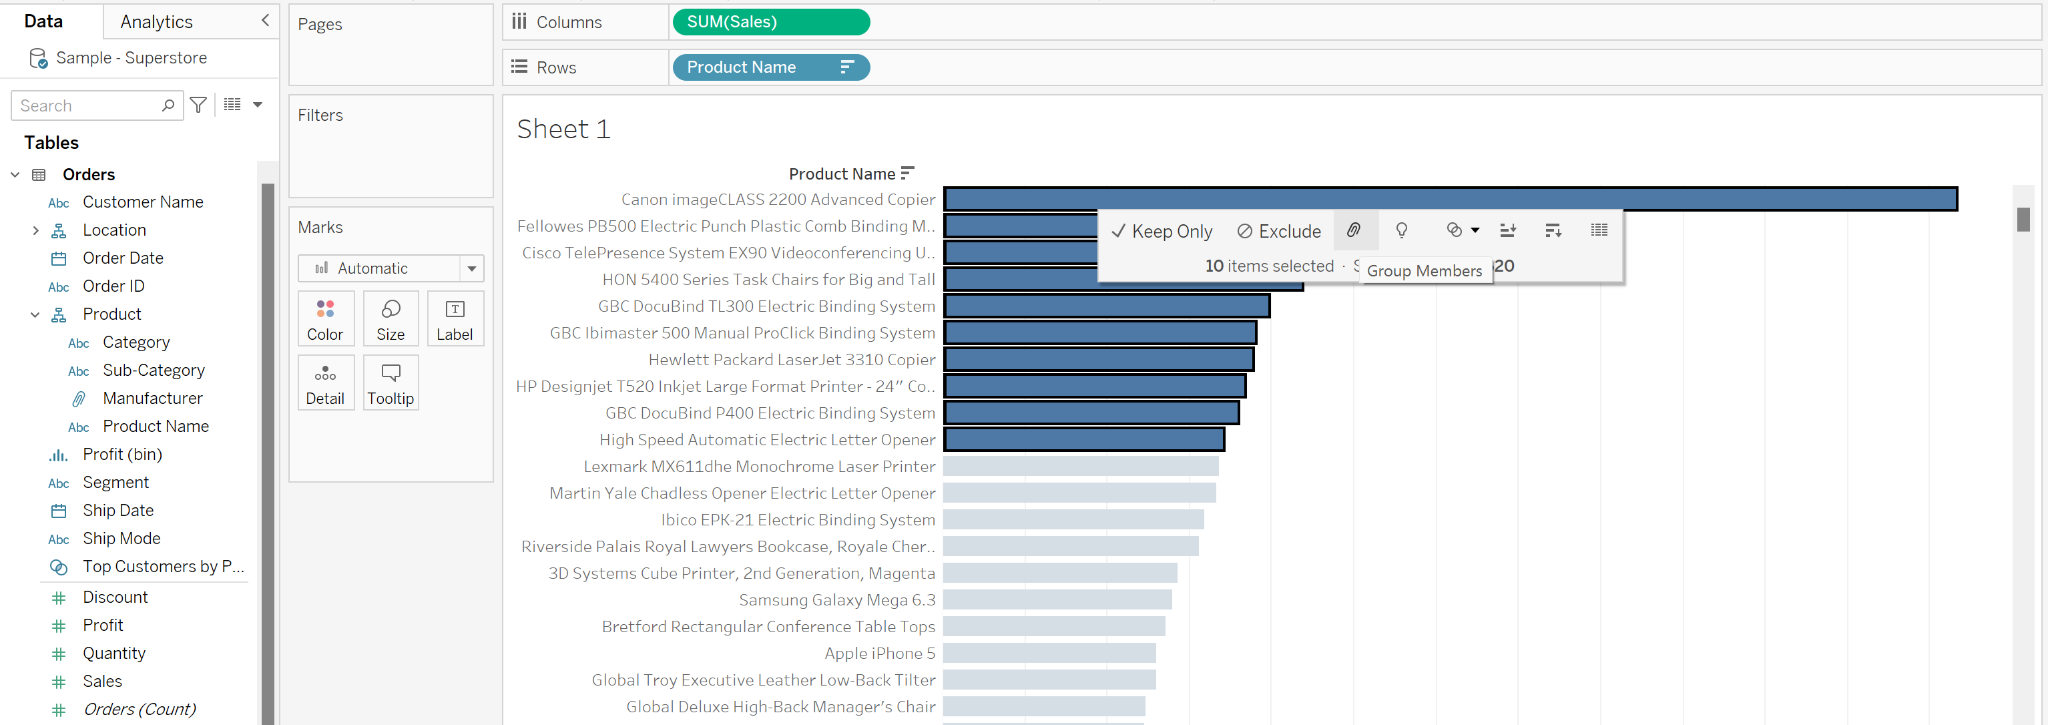
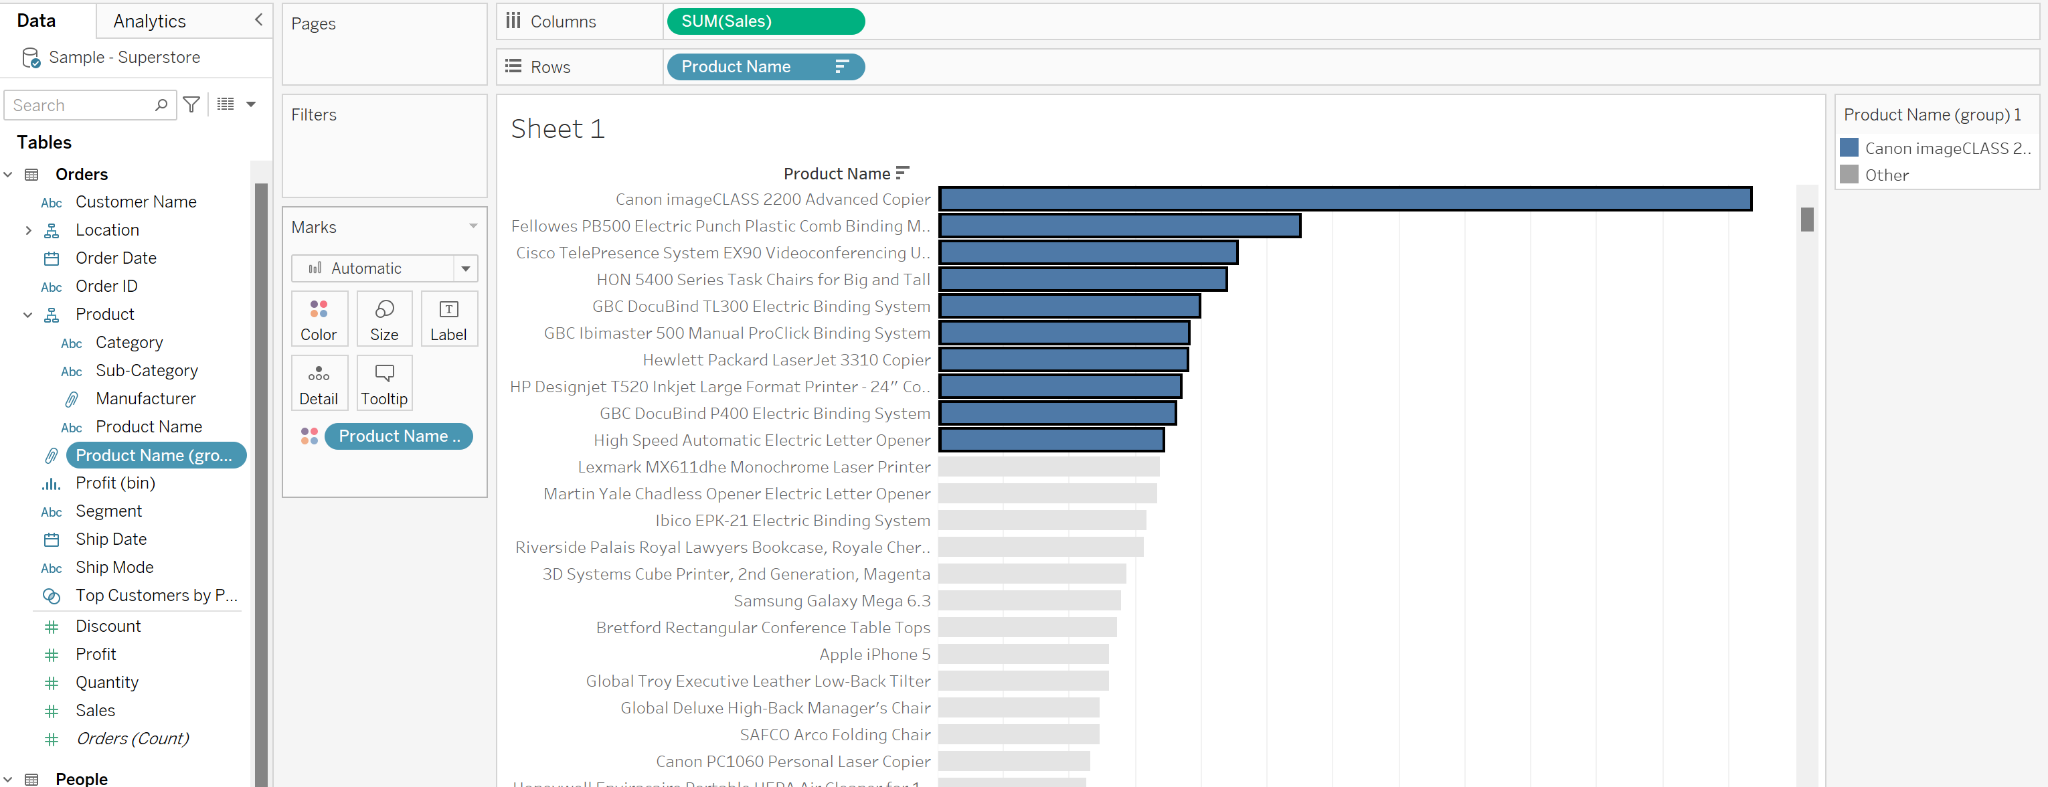
- This groups the selected values as a field in the Data pane
- Tableau will automatically add this group to Color on the Marks Card
Note: Visual grouping is not dynamic. If the data changes and the top 10 products change, you would have to manually change the grouping.
Discrete Grouping:
- Discrete grouping groups data by creating a new field in the data source
- Discrete groups can be used in calculations, filters, and sorting
- Useful when grouping data based on a specific criteria and use it in multiple visualizations
- Also useful when correcting spelling mistakes or to combine dimensional fields
Note:
- When combining two or more values, such as two products in the Sample - Superstore data, the values are concatenated and separated by an “&” symbol.
- To change the group name, right-click on the dimension and edit the alias to the appropriate field name.
- Tableau will automatically add a field to the Data Pane containing the grouped field which can also be renamed.
Conditional Grouping:
- Conditional grouping in Tableau is a way to group data based on specific rules or criteria
- Groupings can be formed using a conditional IF statement
- Useful when there are constant targets
- Also useful when grouping data based on complex on complex patterns or relationships that cannot be accomplished with simple grouping, such as grouping data based on ranges, patterns, or specific values
Example of Conditional Grouping:
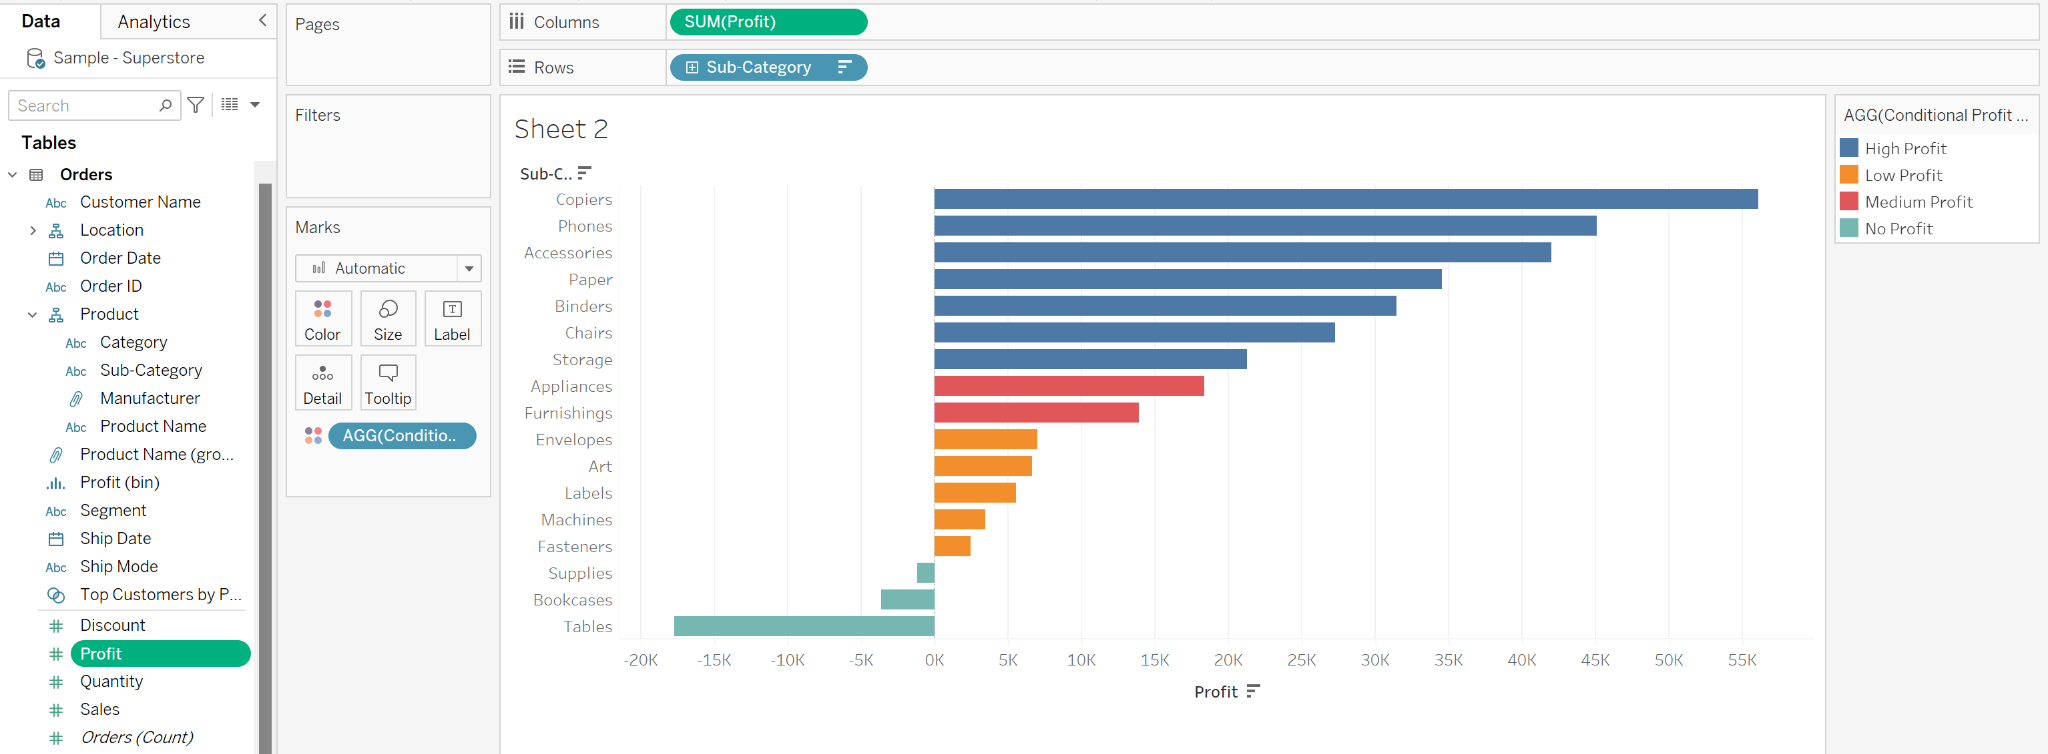
Group the sub-categories into categories based on profit
- "High Profit" for sub-categories with profit equal to or greater than $20,000
- "Medium Profit" for sub-categories with profit greater than $10,000 and less than $20,000
- "Low Sales" for sub-categories with profit greater than 0 but under $10,000
To create this conditional grouping in Tableau, you can follow these steps:
- Create a new calculated field by right-clicking on the "Profit" in the Data pane and selecting "Create" > "Calculated Field".
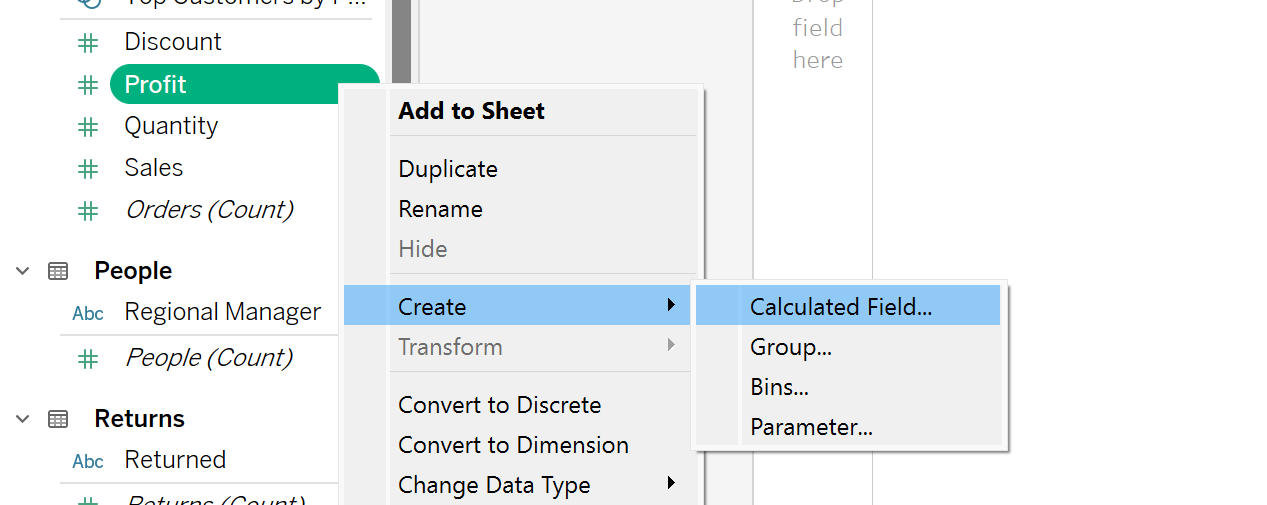
- In the "Calculated Field" dialog box, give the field a name, such as "Conditional Profit Grouping".
- In the formula field, enter the following formula:
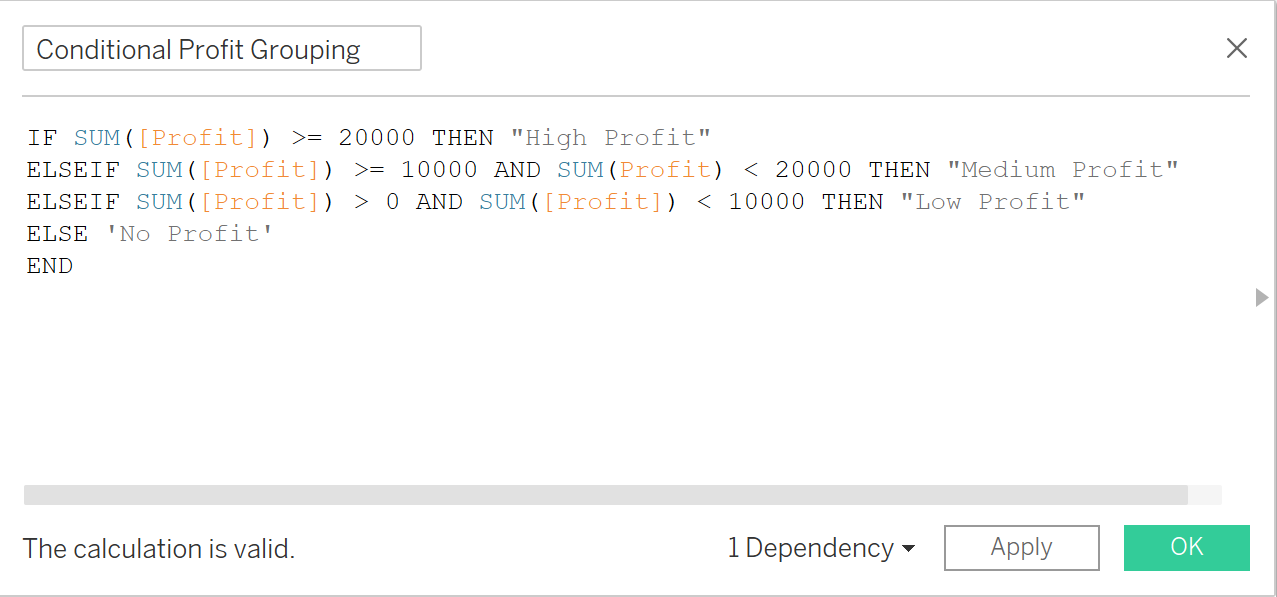
- Click "OK" to create the calculated field.
- Build a horizontal bar chart using Sub-category and SUM of Profit; Sort by Profit descending
- Drag and drop the Conditional Profit Grouping onto color in the Marks card and the bars will split into the four conditional category groupings we created using the calculated field
Now that we've learned all about the three types of grouping in Tableau, you can customize the way data is presented in Tableau and gain new insights into your data. Let's analyze away!