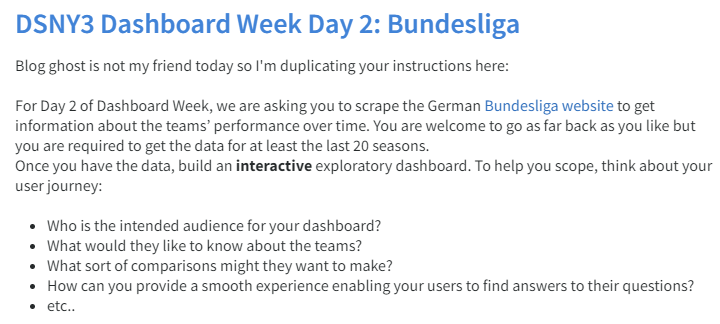
For the 3rd day of Dashboard Week, we were tasked to web scrape the Bundesliga website for team stats and create an analysis.
Web scraping, macros, and APIs haven’t been my favorite to work on in Alteryx, but definitely super enjoyable when the workflow actually cooperates.
We were provided with the URL to start with:
Now my concern was, how do I pull 20+ seasons from the site using the URL?
After some exploring, I realized that only the default year/current year doesn’t have the season specified in the URL, but if we look back at 2021-2022, that was present in the URL:

If we try to type in 2022-2023 at the end of the URL, we will just be led back to the current season page but have the 2022-2023 attached…

which means, this is our way to get the additional data for the 20+ seasons as required!

To webscrape, let’s open Alteryx!
I first needed to create a basic flow where I generate the years that I will be using at the end of the URLs. For that, I used a Generate Rows tool.
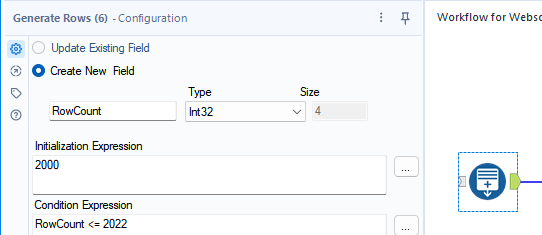
Select “Create New Field” and the Initialization Expression will be the oldest year or the minimum year in the data. So for me, I chose 2000. Then in Condition Expression I set it to Row Count <= 2022, the latest year in the data. I left the Loop Expression as default “RowCount + 1”.
For the next step, I used a formula tool to get the second part of the season. For example, the 2023 part of 2022-2023. To do this, I used the formula tool and created a new column “Year 2”.
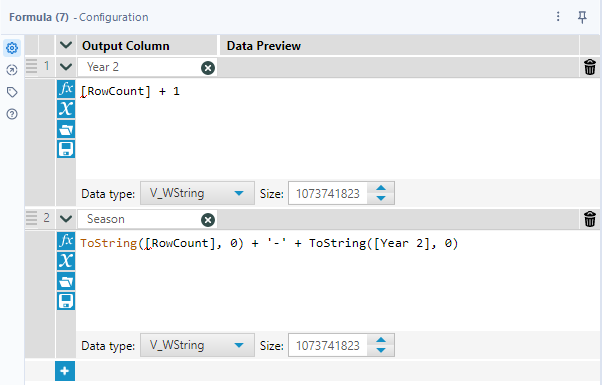
If you look at the image above, you can see that there’s also a second formula to combine the two year parts we have to create the Season column as we know it. 2022 + ‘-’ + 2023 will get us 2022-2023.
This next part here is going to be a bit confusing and I also needed some help navigating this part, but I ended up making a macro here. In a new workflow, drag a Text Input tool onto the canvas.
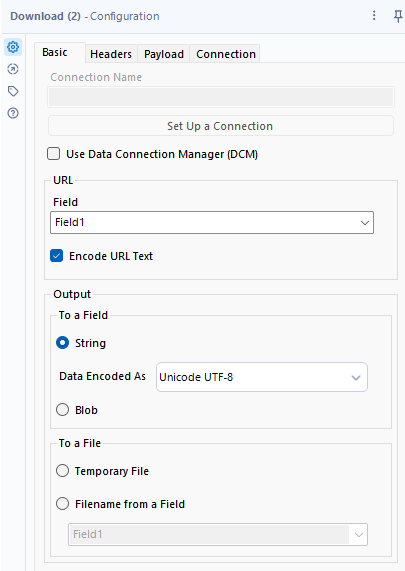
Copy and paste the URL from the website: https://www.bundesliga.com/en/bundesliga/table/2022-2023. Then we need to put a download tool next to it so that we can grab the information from the website. I left everything as default in this tool.

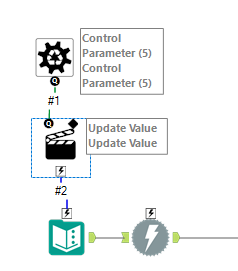
To make it so that we could change the season at the end of the URL, this requires a batch macro. To make a batch macro, drag a Control Parameter into the view and connect the Q anchor to the lightning anchor above the Text Input tool. This will prompt an Action tool to appear and this is the tool that gets configured.
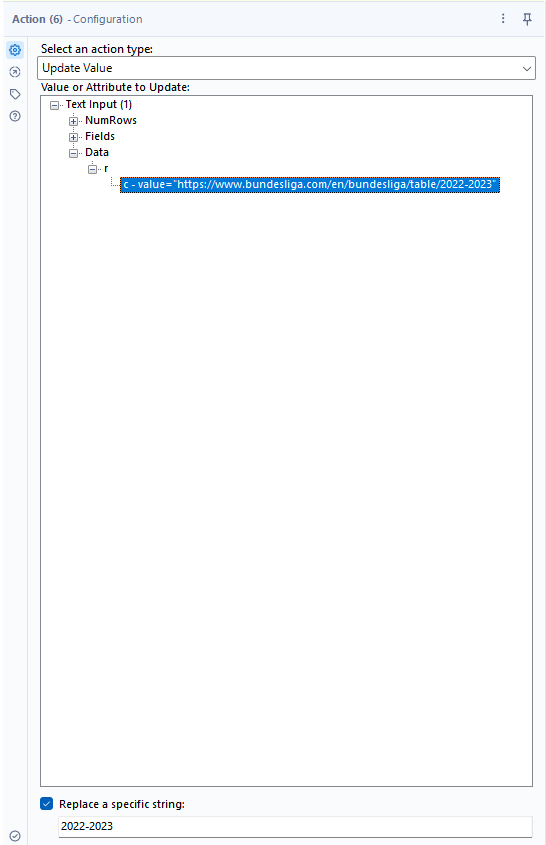
The configuration is as follows:
- Select an action type: Update Value
- Value or Attribute to Update: Text Input > Data > r > c-value=”https://www.bundesliga.com/en/bundesliga/table/2022-2023”
- Replace a specific string: 2022-2023
To be able to use this macro in our main workflow, connect a Macro Output tool to the right of the download tool and save the workflow.

Back in our main workflow, right click in the canvas and bring in the macro we just created.
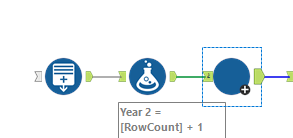
You can always customize the way the tool looks with an image or a different color and make it cuter, but I didn’t do that here. Personal preference.
After we run this flow, the results will look like this:

There is one row for each season we decided to extract (between 2000-2001 to 2022-2023).
To make it less confusing, I dropped a Select tool at this point and renamed Field 1 to URL. Then I attached a Browse tool to the end so that I can look into a cell in the DownloadData column and see what information I need to Tokenize. (Tokenize extracts either the entire match or the 1st marked part of a match. This allows you to extract just part of a match. More on this in a future blog or read one of the blogs by my fellow Data Schoolers!) To tokenize and get the data that we need, I used a RegEx tool. The RegEx tool will come up quite a bit in this blog so bear with me. The configuration I used is as follows:
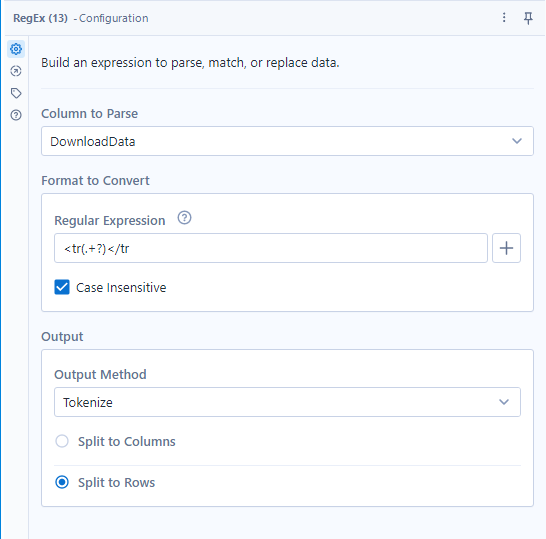
Tokenizing with the Regular Expression above gives us one row per team per season.
In the next 10 RegEx tools, I parsed out the bits of the DownloadData that contained the:
- Team name
- Rank Number
- Matches
- Wins
- Draws
- Losses
- Goals
- Points Scored By Team:Points Scored by Opposing Team
- Points
- Season

An example of the RegEx configuration I used looks something like this:
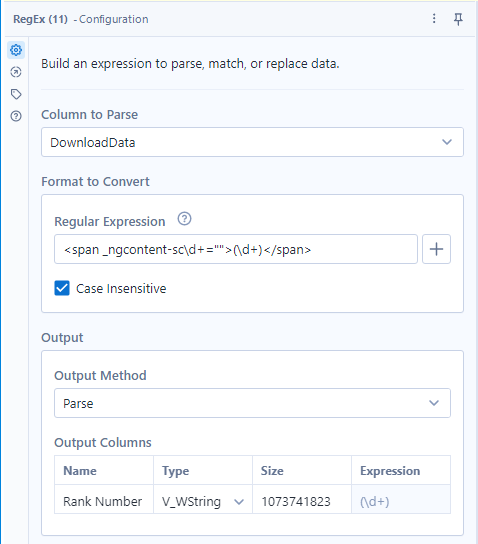
- Note how other than the capture group being (\d+), we also have \d+ somewhere else in the Regular Expression. This is because different seasons/years have a different number value there and to accommodate for that, we needed to put \d+.
The results look like this:
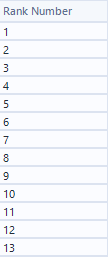
Then I exported the data into a hyper using an Output tool.
At least, that’s what I originally did.
In making this dashboard, I was not really sure what charts to make so I didn’t make a sketch of what I could make and I just explored the data. Later on, when making one of the charts, I realized I needed to go back into Alteryx and make some changes to the flow to make it easier to build the chart I was hoping to build. That’s where this bit comes into play:

- To extract just the beginning year from each season, I used the Left() function to extract the year
- Then I used a Select tool and dropped some fields such as DownloadData and DownloadHeaders. I also took this chance to rename any fields necessary.
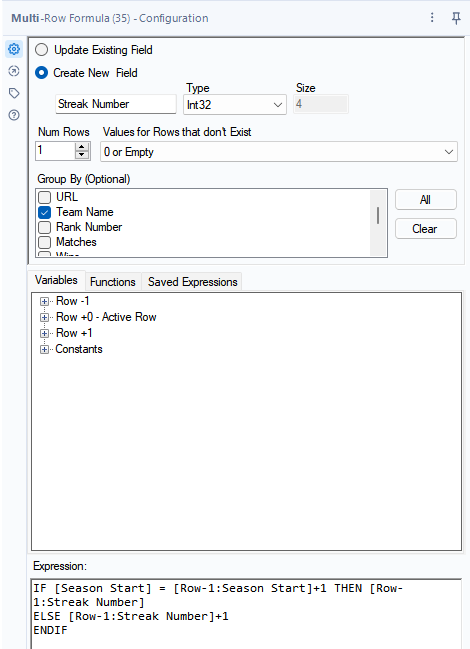
- After that, I needed to use two Multi-Row Formula tools to find the Streak Number (this will all make sense in a bit) and Streak Length
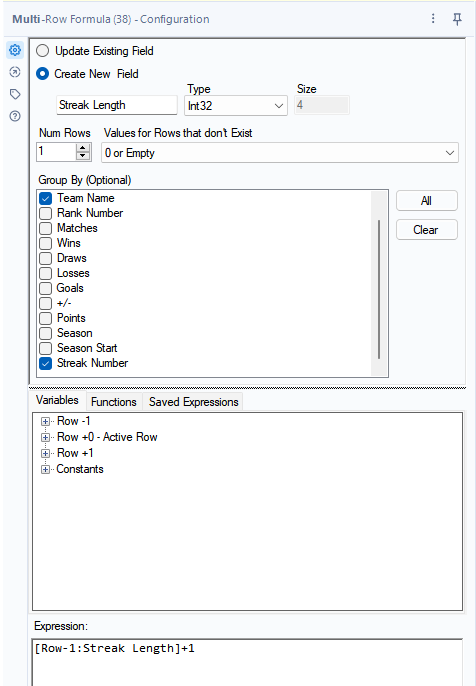
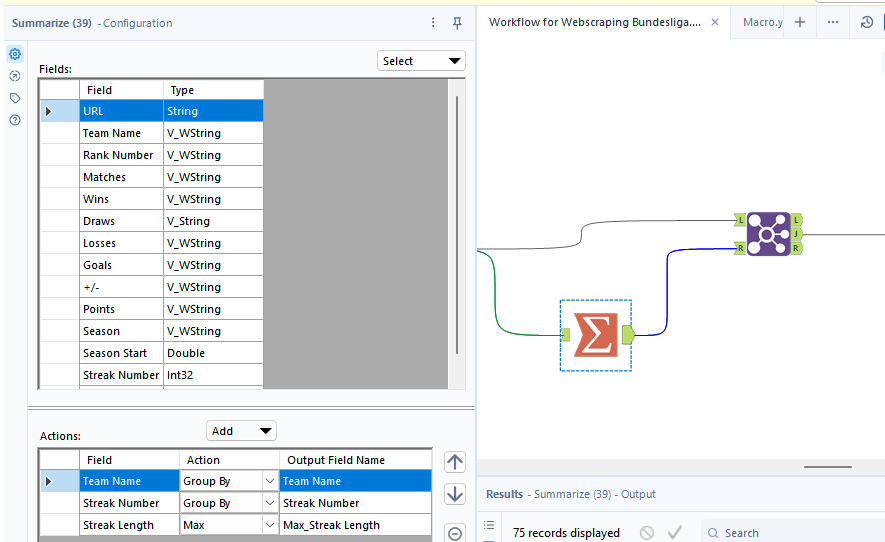
Then I needed to use the Summarize tool in order to get the Maximum Streak Length and JOIN it back with the main work flow.
Last but not least, run it and save it so we can use it in Tableau
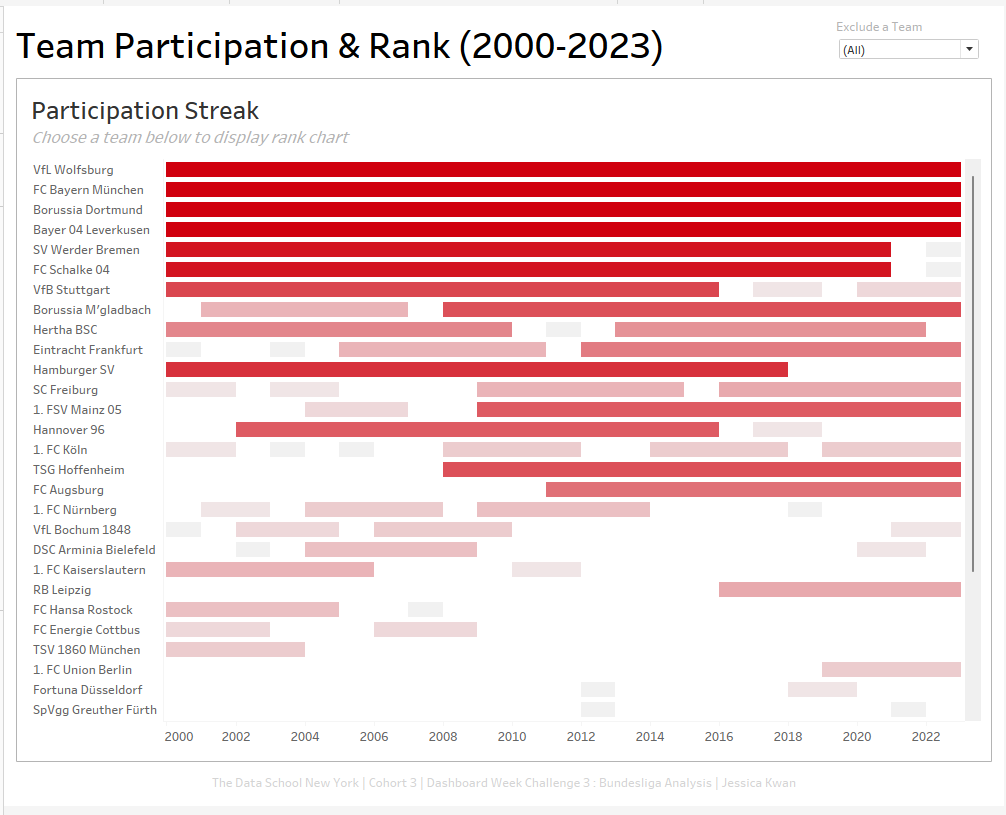
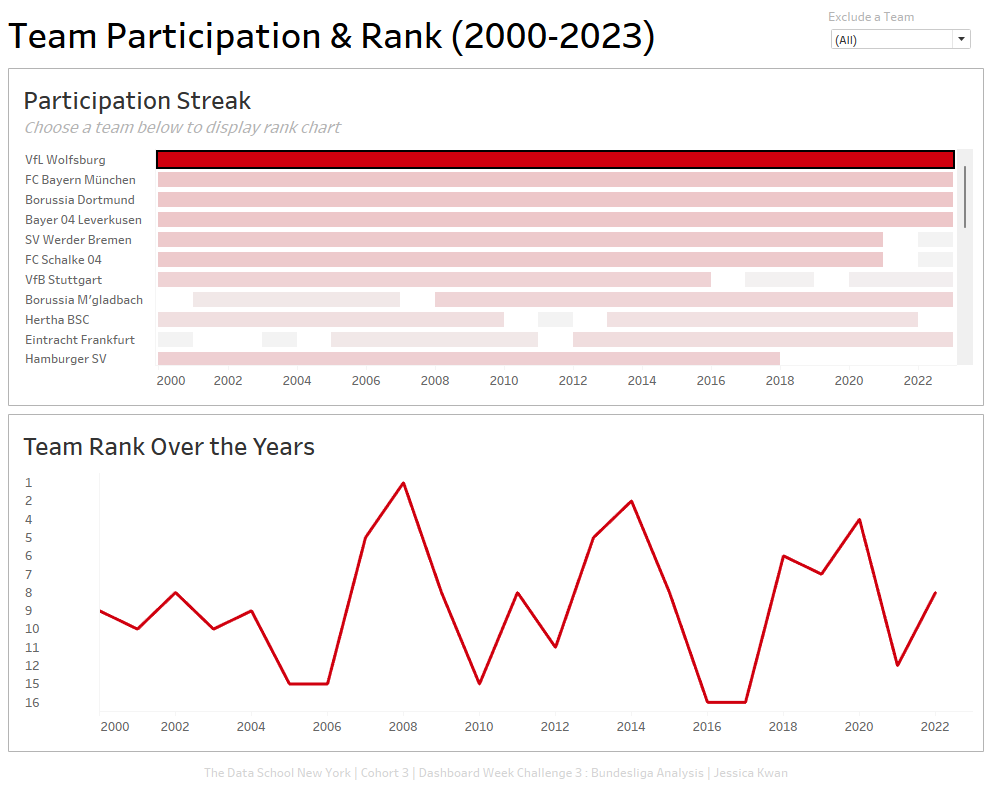
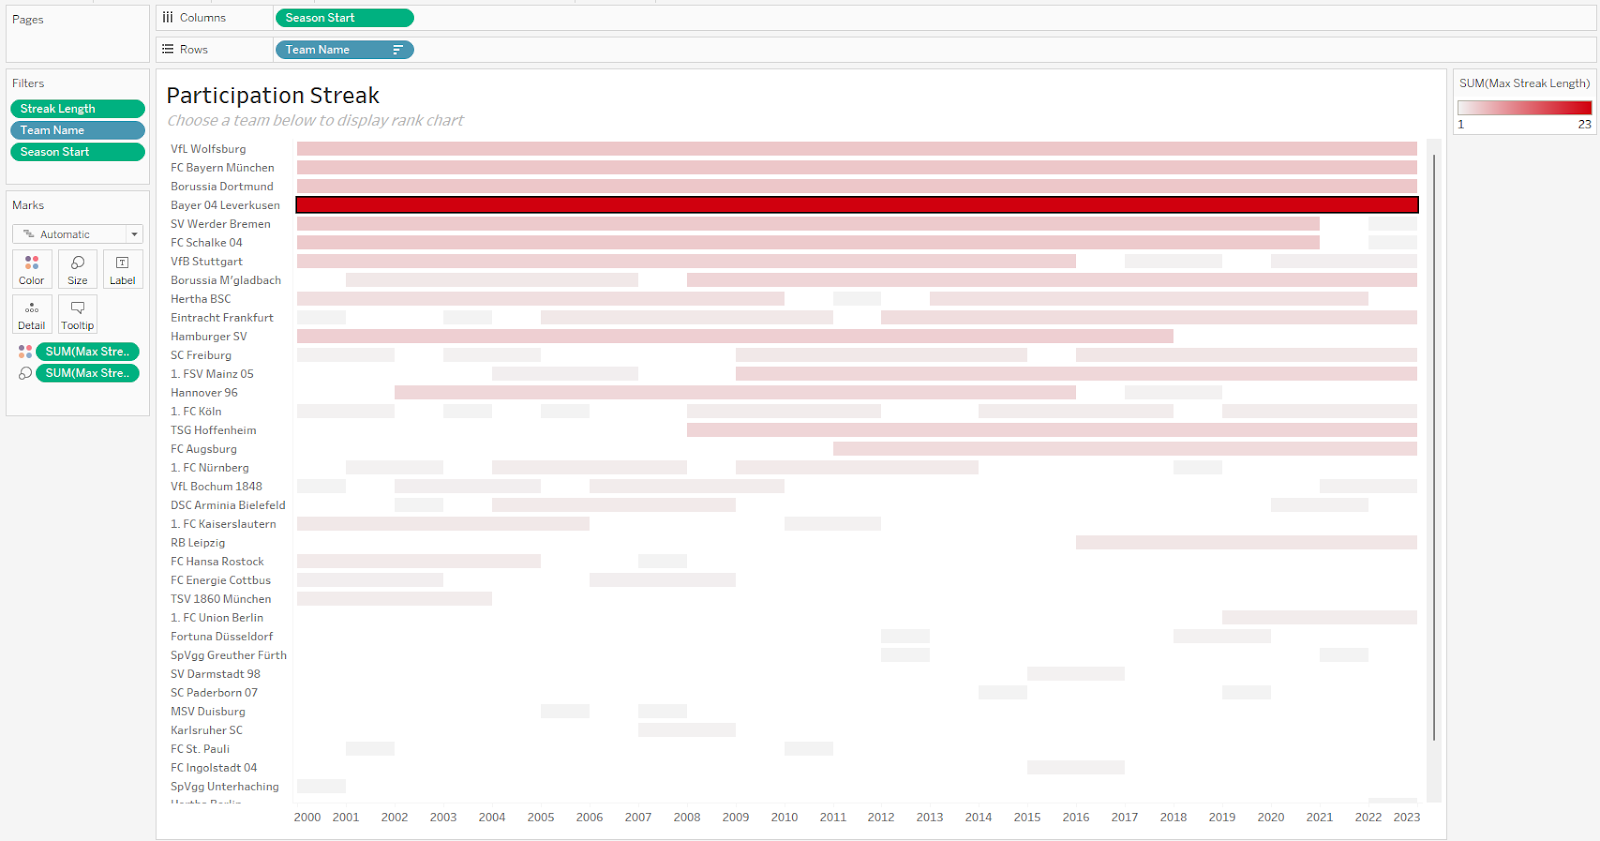
If we refer to the image at the front of this blog containing the requirements for this project, we can see that we need to make a dashboard that is interactive. I wanted to take the opportunity to practice using Dynamic Zone Visibility. So here, we can see that when a bar is clicked, a line chart correlating to the team chosen will appear. This line hart shows the team rank over years. Clicking away will clear the selecting and the line chart will be hidden again. Note that there is also a filter on the top right corner so that users can filter out teams they are not (or least) interested in.
Hope you enjoyed learning about the web-scraping workflow for day 3’s challenge. And until next time!
