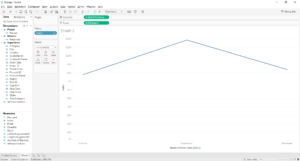
One problem people often have when reporting company performance is updating their charts. In particular, you generally want a chart to show performance in recent months or years, but you don’t always know exactly when new data will arrive. If you use your date field as an ordinary filter and select ‘Last 3 months’, it only shows you the last 3 calendar months, not the last 3 months of your data. How, then, do you get Tableau to show only the last 3 months of data, rather than the last 3 calendar months?
You’ll need the Index function. Follow these 6 simple steps: I’ve used the Superstore data set, but this will work in any data set with a measure and a date field.
- Drag Order Date to Columns (select discrete months) and Sales to Rows.
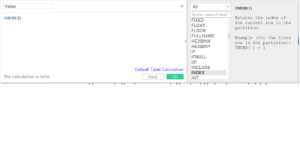
- Create a calculation for the Index function, as below. Right-click on your calculation and convert it to Discrete.
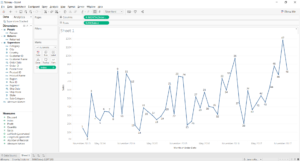
- Drag your new Index calculation to Label, so that numbers show for each mark on the view.
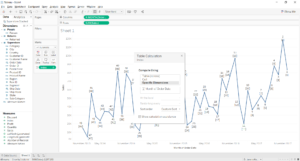
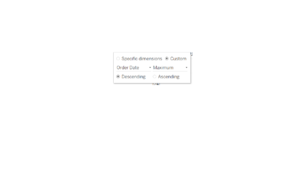
- Edit the table calculation for the Index calculation on the marks card (you’ll need to do this in the pill on the marks card, not the calculation in your measure list). Choose Specific Dimensions > Custom Sort, then choose your date field, select Maximum, and sort by Descending. This will label your marks so that the most recent month’s marks are labelled 1, the second most recent month’s marks are labelled 2, and so on.
- Drag your Index table calculation from the Label shelf to Filter. Select 1, 2 and 3 as below: this filters out everything except the three most recent months.

- You should see a graph of the three most recent months of data in your view. If particular months do not have any data, the chart will not include them.
