


There’s nothing more frustrating than using a Top 10 Filter and seeing less than 10 things in the view. You know you’re an intelligent person, you know you’ve set it up right. Tableau is even confirming to you that there are less than 10 things in the view!

So what can you do? Hopefully one of these two examples will help solve your problems…
Example 1:
Using our favourite Sample Superstore dataset…
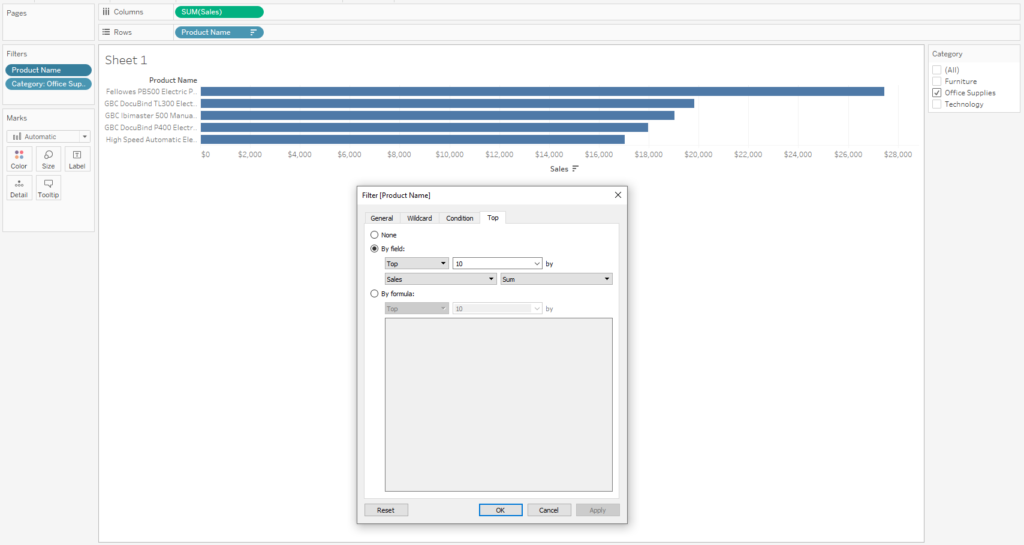
I want to see the Top 10 Products (ranked by sales) for the Office Supplies Category, but hang on, I only have 5 in my view. What’s going on?
The issue here lies with the fact that you’re trying to perform 2 filters, but Tableau doesn’t know what order to perform them in and it defaults to performing the Top 10, before the Category filter. This all comes back to the Order of Operations and there’s a great blog from Débora explaining all about it.
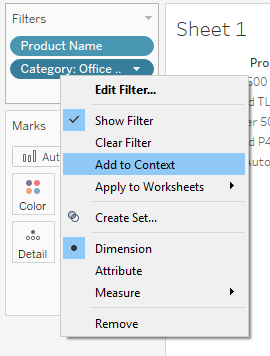
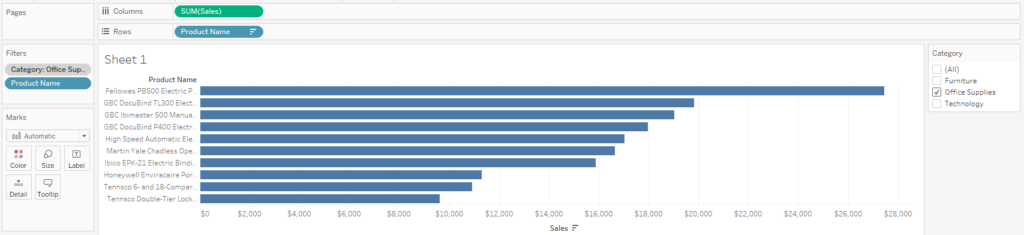
For the purposes of solving this particular problem, all you need to know is that changing Category to a Context Filter will tell Tableau to perform that calculation before the Top 10 and we now have 10 things in the view!
Example 2:
We have our beautiful Top 10 from Example 1 and we’re feeling happy. Wouldn’t it be nice if we could also have this broken down by Region? Let’s drag Region onto the Rows Shelf:
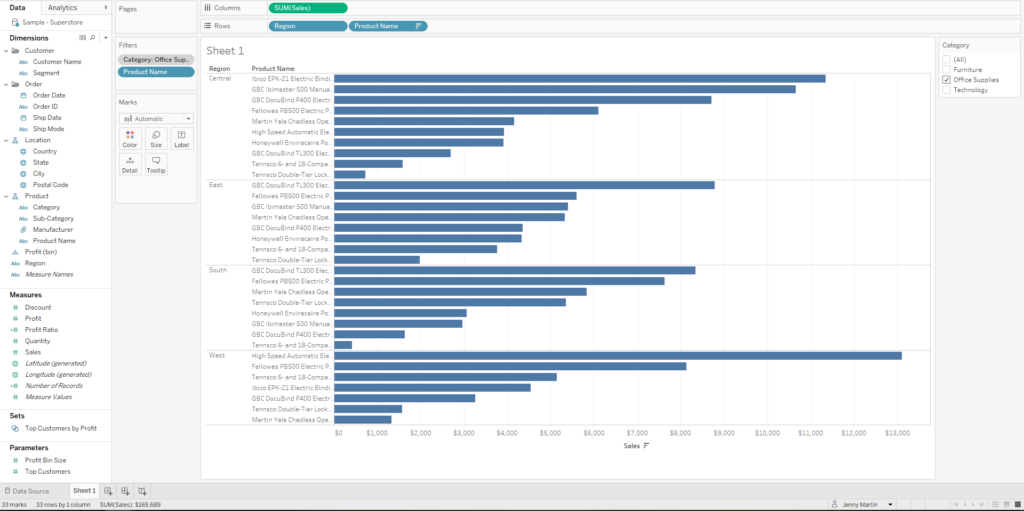
We have 4 Regions, we want a Top 10 for each region, yet we have 33 marks in the view. Oh no it’s funked up again! Can we solve this by adding Region to the filter pane and adding it to context? Unfortunately not, the view remains unchanged.
The solution involves Table Calculation Filters (which you may want to refer back to Débora‘s blog for, riiiight at the bottom). So let’s remove our Top 10 Filter and get started.
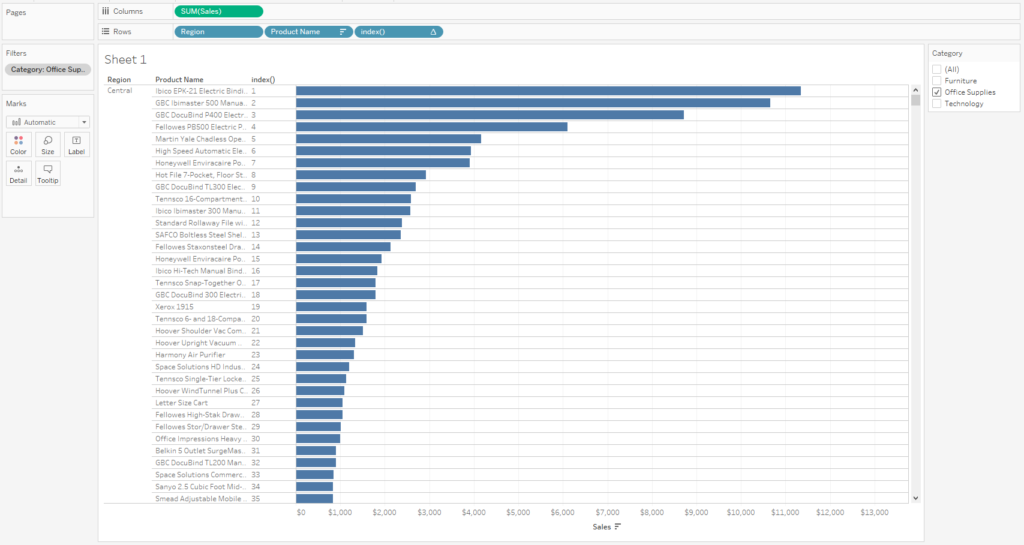
If we double click on our Rows Shelf, type index(), hit enter and change this to a discrete field, we see that we have basically numbered each Row, starting from 1.
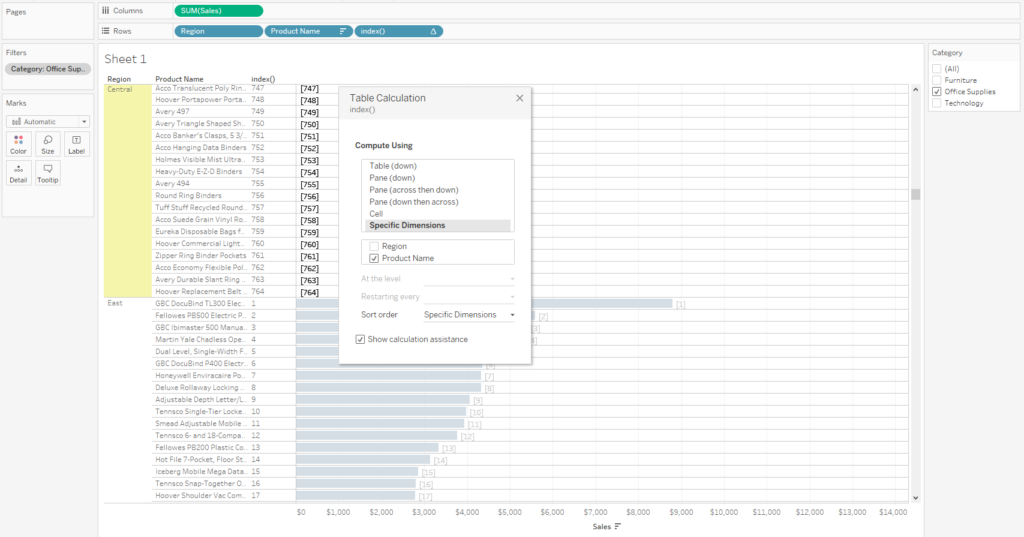
What we want, is for this numbering to restart from 1 for each Region. So we need to edit our Index Table Calculation. Unticking Region in the menu basically means that Tableau will restart the calculation every time it hits a new Region.
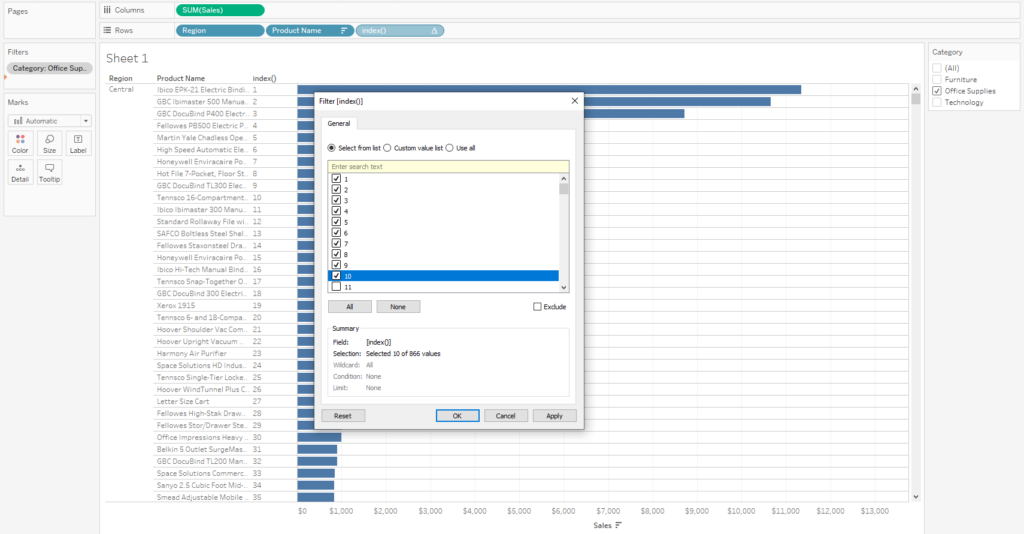
So now we can just drag this Index pill into the Filter Shelf, and select the numbers 1-10:
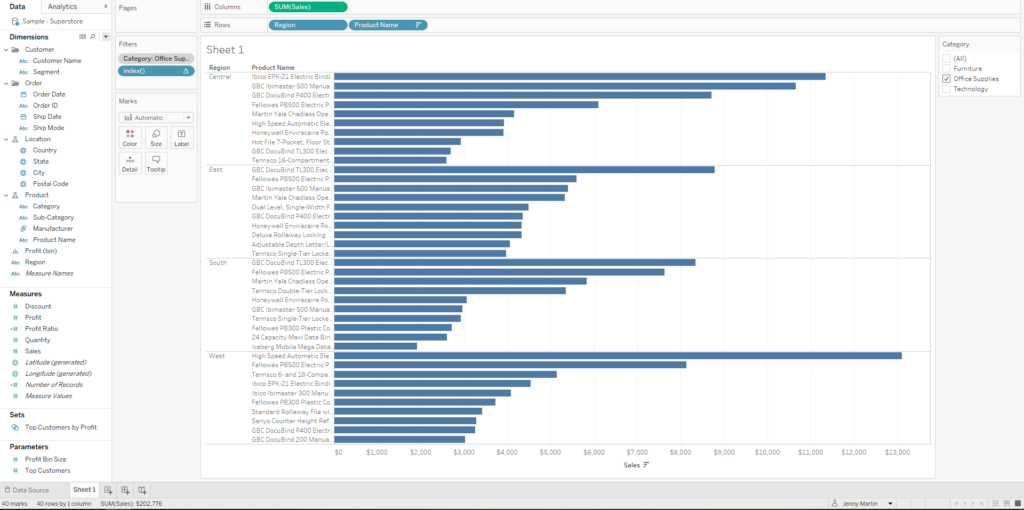
And there you have it! 40 marks are in the view and we have our Top 10 Products from the Office Supplies Category, ranked by Sales, for each Region. A bit of a mouthful but useful!