


This week is Dashboard Week for DS14, which means a blog every single day! Andy posts our task around 9am and our first one can be found here. It involved webscraping data about UFO sightings, spooky.
Step 1 – Sketch:
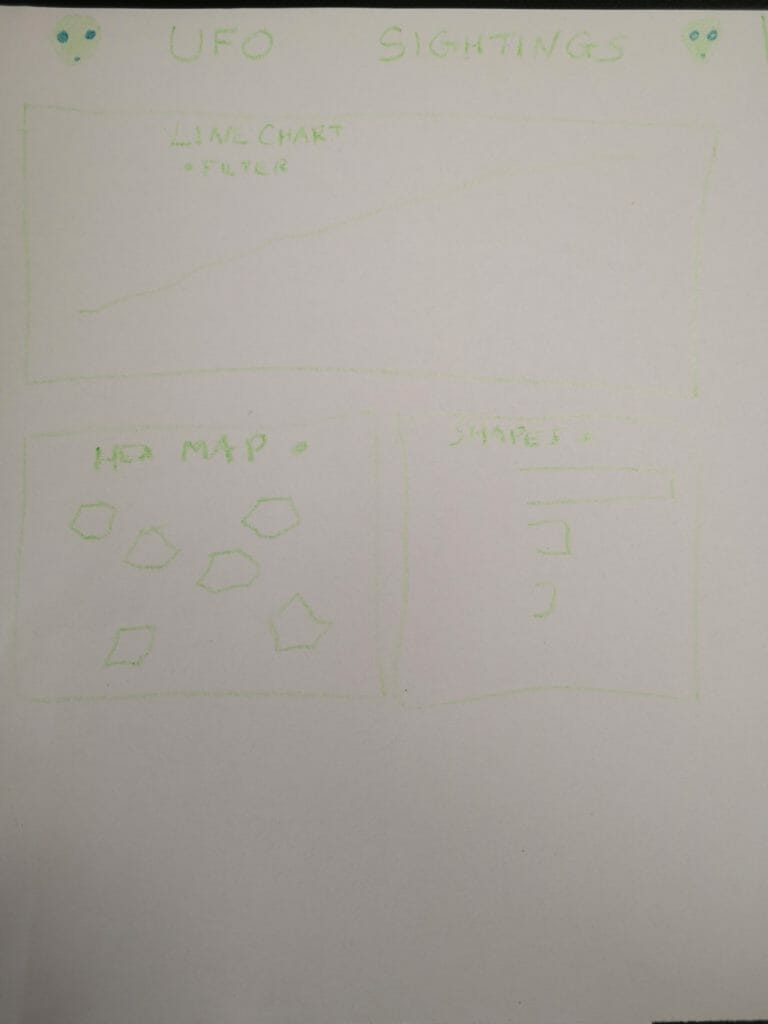
After a quick peek at what fields were included in the data, I made a sketch of what I wanted my dashboard to look like. I decided to try to keep it simple today as I was assisting with Natalia’s webinar (and it would be great to finish early to do a little bit of prep for my webinar tomorrow too!)
I thought that restricting myself to when, where and what questions would ensure I wouldn’t get too bogged down in webscraping. All I needed from the data was the Date, State, Shape and Count of UFOs.
Step 2 – Alteryx:
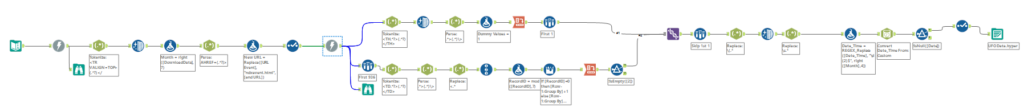
Now I had a plan, I could head over to Alteryx – yay! The workflow was pretty simple with a third of the tools being RegEx (classic webscraping!) You may notice that there are 2 download tools, as each month linked to another table that had a breakdown of each UFO sighting.
After the second download tool the workflow splits into two before union-ing back together. As the headers for the tables were contained in the <thead> tag, whilst the actual data was in the <tbody> tag, I just found it easier to split these out, deal with them separately and then stick them back together at the end. At this point, I filtered out any sightings that were outside of the US, as this is where the majority of sightings occurred and what I wanted my dashboard to be focused on.
The only other interesting part of this flow was around the dates. The date that was contained in the table had the structure dd/MM/yy, but since we had dates from the 1900s and 2000s, Alteryx was making 1950 into 2050. There are many ways to deal with this, but since I had another field with the format MM/yyyy, I just used RegEx to replace the final 2 digits in the initial field with the 4 digit year from the other field. This then went through the DateTime Parse tool easily. Apart from the years 0201 and 0219, which were probably mistyped, but I excluded these, rather than making any assumptions about what they should have been.
Step 3 – Dashboard:
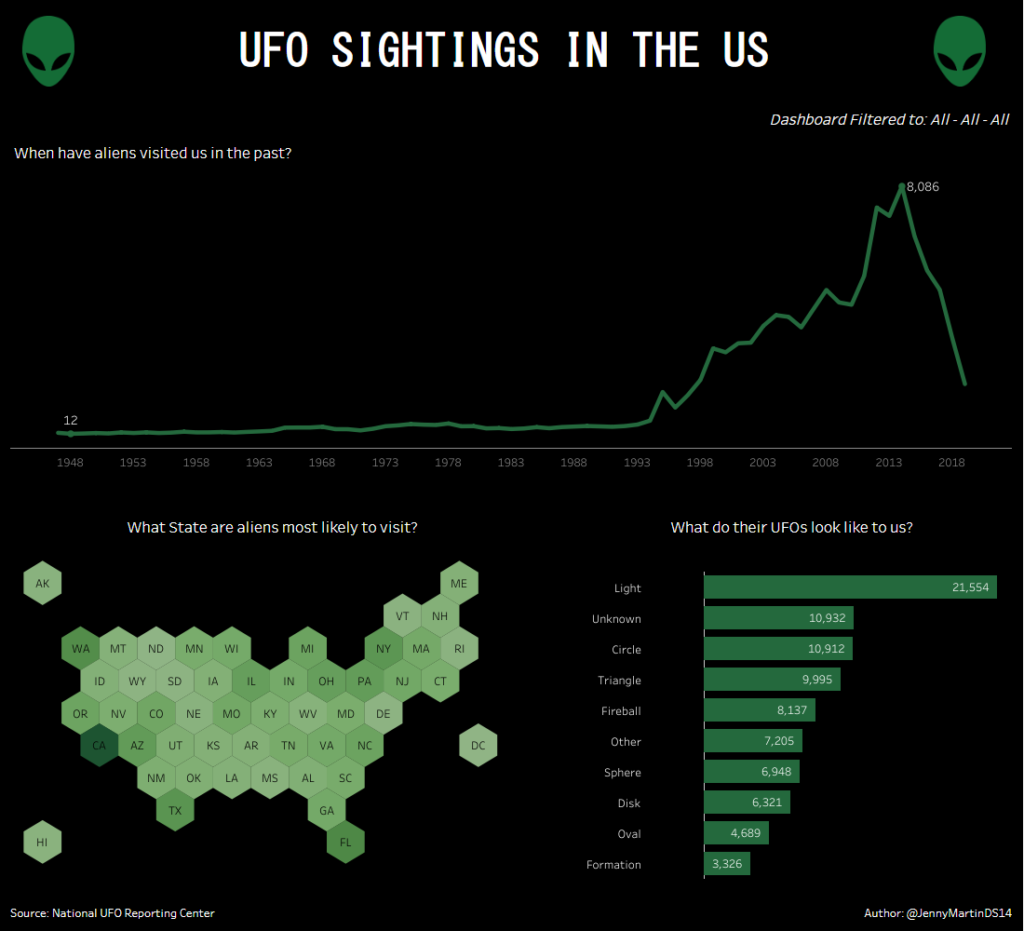
Once I had the data, all that was left to do was make my sketch a reality. I didn’t run into too many difficulties here – though I did pop back to Alteryx a couple of times to make sure all the dates were correct etc. I decided to exclude all the dates with less than 10 sightings and so the data ranges from 1947 to 2019.
In the top right, under the alien, I decided to include “breadcrumbs”. Since all the charts on the dashboard will filter one another, I thought it would be useful for the user to be able to see what filters were currently affecting the view. Kolsuma wrote a great blog on this subject a short while ago that you should definitely check out.
Step 4 – Blogging:
All that was left to do was write this blog. I’ve enjoyed the first day of Dashboard Week and look forward to seeing what Nick and Lily have in store for us tomorrow!