


Diving into a new dataset can feel like cracking a code. Each column and row can hold an abundance of information, but where do you start? This blog outlines a three-step approach to understanding and decoding any dataset, turning raw data into actionable insights.
1. Data Exploration and Discovery Overview
Start with Curiosity: Open your dataset and scan through it. Data preparation tools such as Tableau Prep, Power Query, or Alteryx are great for this. What data fields are recorded? How are the records formatted? Identify the categorical variables such as city, and continuous variables such as sales. This initial overview gives you a sense of the data collected.
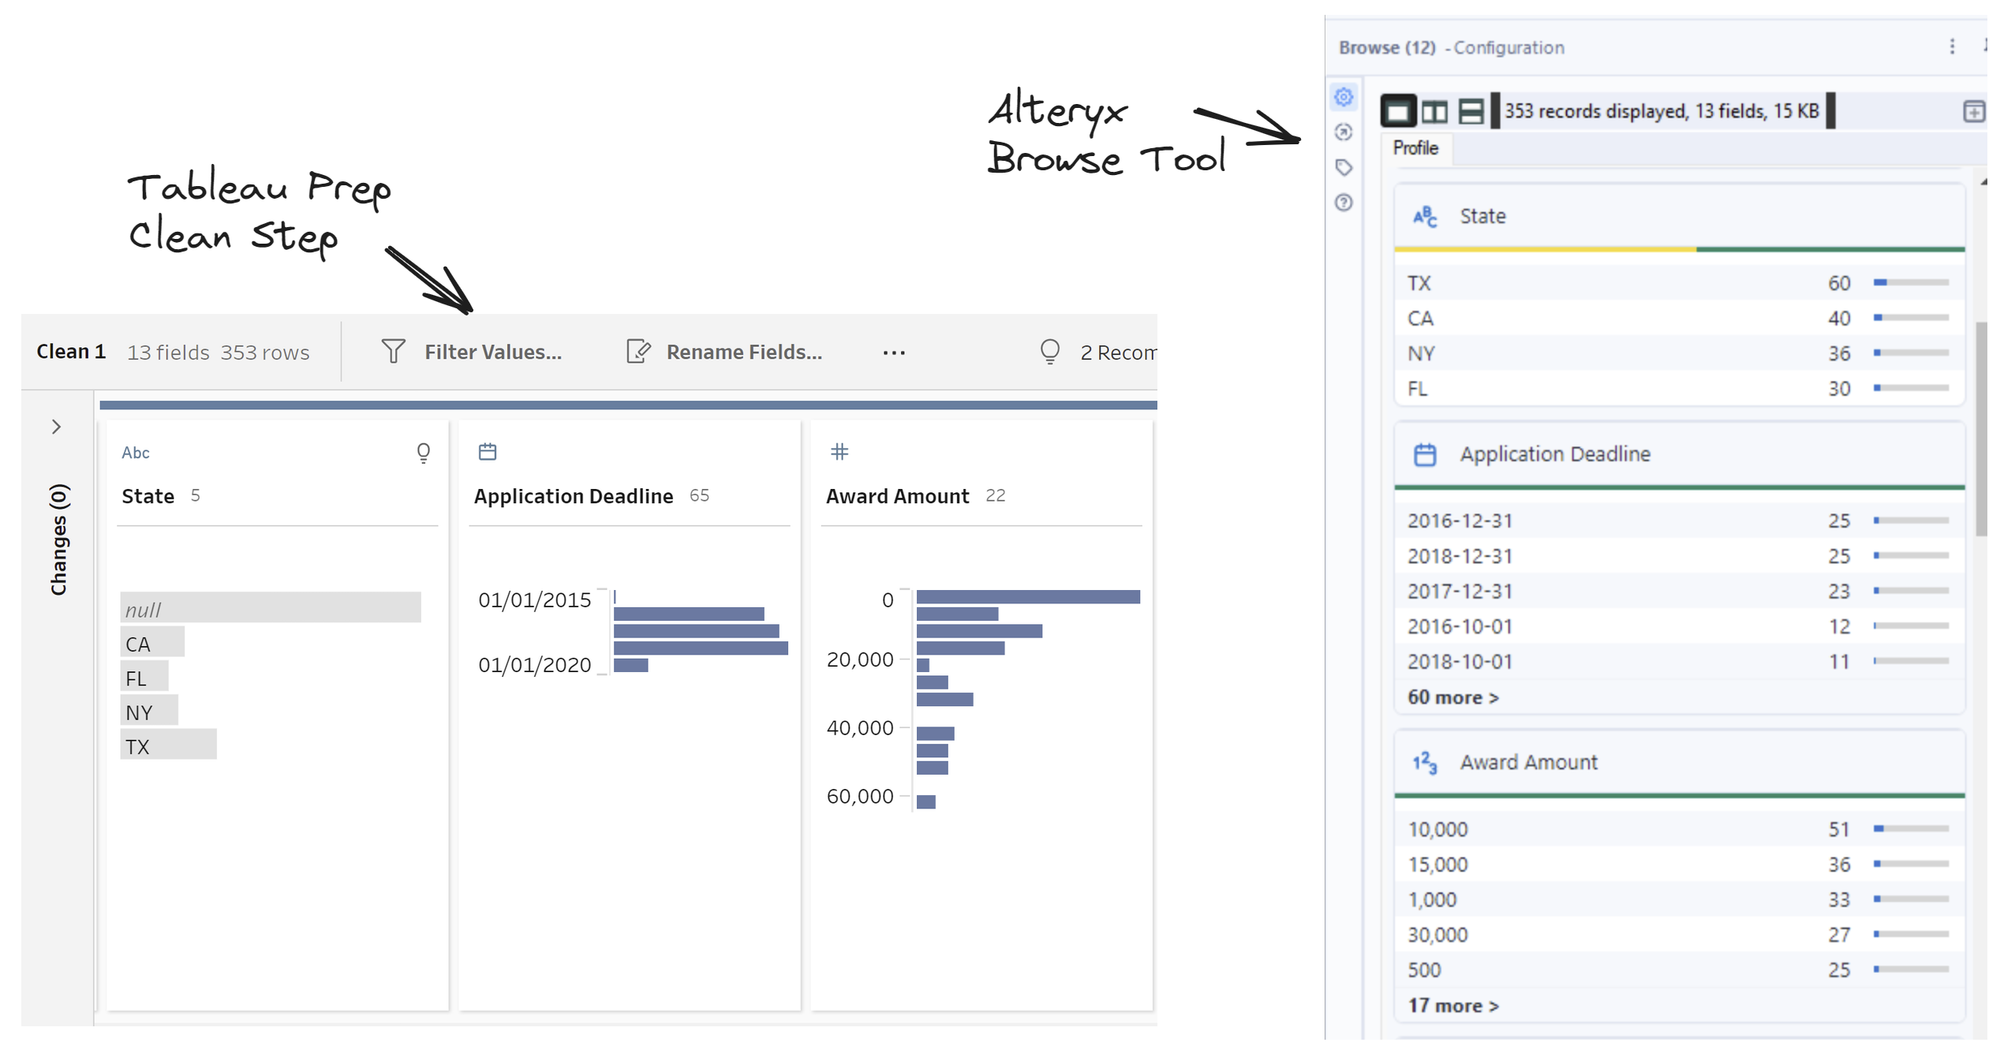
Most data preparation tools also allow you to quickly see the unique values for each data field, check the most and least common values for each data field, and the minimum and maximum of each continuous variable. In Tableau Prep this can be seen in a clean step, and in Alteryx this can be seen in a Browse tool. This further browsing gives you a sense of the data's scope
Check for Consistency: Are there any inconsistencies in how data is entered? For instance, are dates in a uniform format? Consistency is key to accurate analysis and cleaning.
Identify Missing Values: Missing data can skew your analysis. Note where these gaps are and consider how they might impact your findings. Sometimes, however, data is missing on purpose!
2. Cleaning Data and Setting Data Types
Tidy Your Data: Cleaning involves removing or correcting anomalies and inconsistencies found in the data overview step. This might mean standardising date formats, correcting misspellings in categorical data, or dealing with outliers in numerical data.
Define Your Data Types: Ensure each column in your dataset is set to the appropriate data type (e.g., text, numeric, date). This step is crucial for effective sorting, filtering, and analysis later on.
3. Analysing Data: Ranking, Sorting, or Aggregating
Ranking: Ranking data can reveal hierarchies or priorities within your dataset. For example, ranking sales data by region can show you where your best and worst-performing areas are.
Sorting: Sorting your data can help identify trends over time or differences among categories. Sorting by date, for example, can show you how metrics have changed over time.
Aggregating: Aggregating data involves combining data points to summarise or find averages. This can help in understanding the big picture, like the average sales per month across a year.
This analysing step will mean that you have explored the data enough to know the main information surrounding the records.
Bringing It All Together
Once you've explored, cleaned, and analysed your data, you're in a strong position to draw meaningful insights. Perhaps you've discovered a trend in customer behaviour, identified a bottleneck in production, or uncovered a potential market for expansion. The key is to approach the data methodically, always questioning what the data is telling you and why. This is when you look towards using data visualisation software to tell the story if the data.