


Have you ever found yourself nodding along to a conversation about data granularity, too embarrassed to jump in and ask for an explanation? You're not alone. Let's break it down with an easy analogy: think of a pile of sand next to a pile of rocks.
Granularity in Data: Sand vs. Rocks
The term "granularity" pops up a lot in data discussions, but what exactly does it mean? Simply put, more granular data is "finer," meaning it contains more detail, just like grains of sand. With enough grains, you could create a detailed and shaded picture. On the other hand, less granular data is "coarser" and has less detail, similar to using a handful of rocks to form an image. The outcome is much rougher and less precise.
Identifying Your Data's Granularity
So, how can you tell the level of granularity in your data? Data records are typically stored as rows, with headers to clarify what each entry represents. These entries can be measures (usually numerical like profit) or categorical (like country). At The Data School, a common question is, "What decides the granularity in this data?"
A collection of categories determines your dataset's granularity if they are the smallest number of categories that can uniquely identify a row in your dataset.
For example, if given only the data entries for categories that determine the granularity, you should be able to pick out exactly one record from the entire dataset—the one that matches the categories defining its granularity.
When datasets are small, this can be done by eye - but this quickly becomes impossible when given a more complex table. In this case, we can use tools like Tableau Prep to assist us in searching for the granularity.
Notice that talking about the granularity of a table doesn't make much sense if you have duplicate records - there is no way to distinguish identical rows! In this case, there may be meaning to the duplication for example if one customer has ordered the same item twice, or it could be an error in the data. In either case, this should be checked with someone who knows the data.
Example 1: Simple granularity
The following table has it's granularity set by Date:
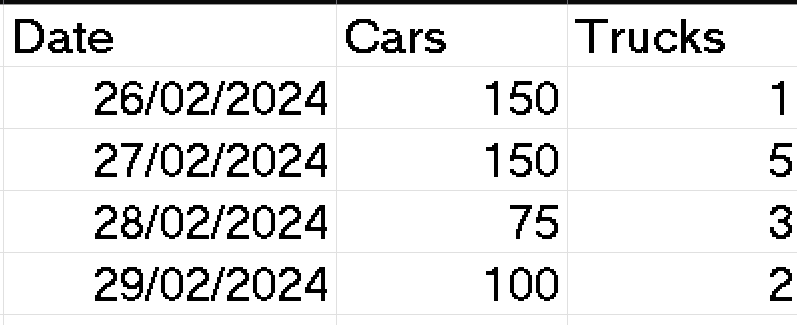
This is because there is a unique date per row, and here we are considering Date as categorical. We did not use Trucks since it is not categorical - it is a measured value.
Example 2: Granularity set by multiple columns
In the following small dataset, both the Customer data field and the Date of Order data field have duplicates when considered alone - if you asked me "what day did Alex order?" I could not answer since there is not a unique row containing Alex.
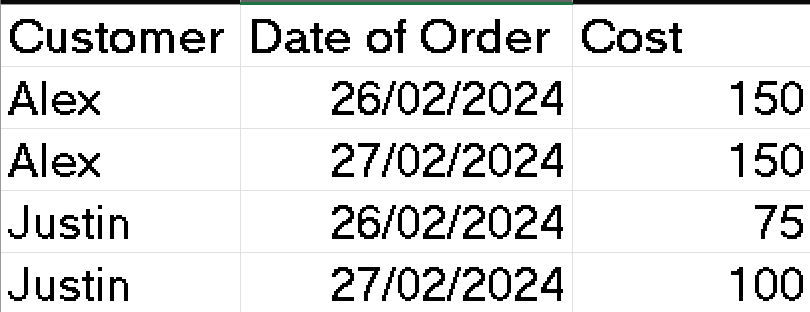
When considered together, Customer and Date of Order tells us exactly which row we are looking at! We don't use Cost as our category since it is a measured field. Note that dates are not always categorical field.
Conclusion
Understanding data granularity is crucial for analysing and utilising data effectively. Whether you're working with sand-like detailed data or dealing with broader, rock-like datasets, grasping this concept will help you navigate data discussions with confidence.