


Relationships in Power BI can be mysterious, but they can be understood using the language of joins (called merges in Power BI). Here is a small mock dataset created to demonstrate with the fact (main) table on the left, and a dimension (lookup) table on the right:
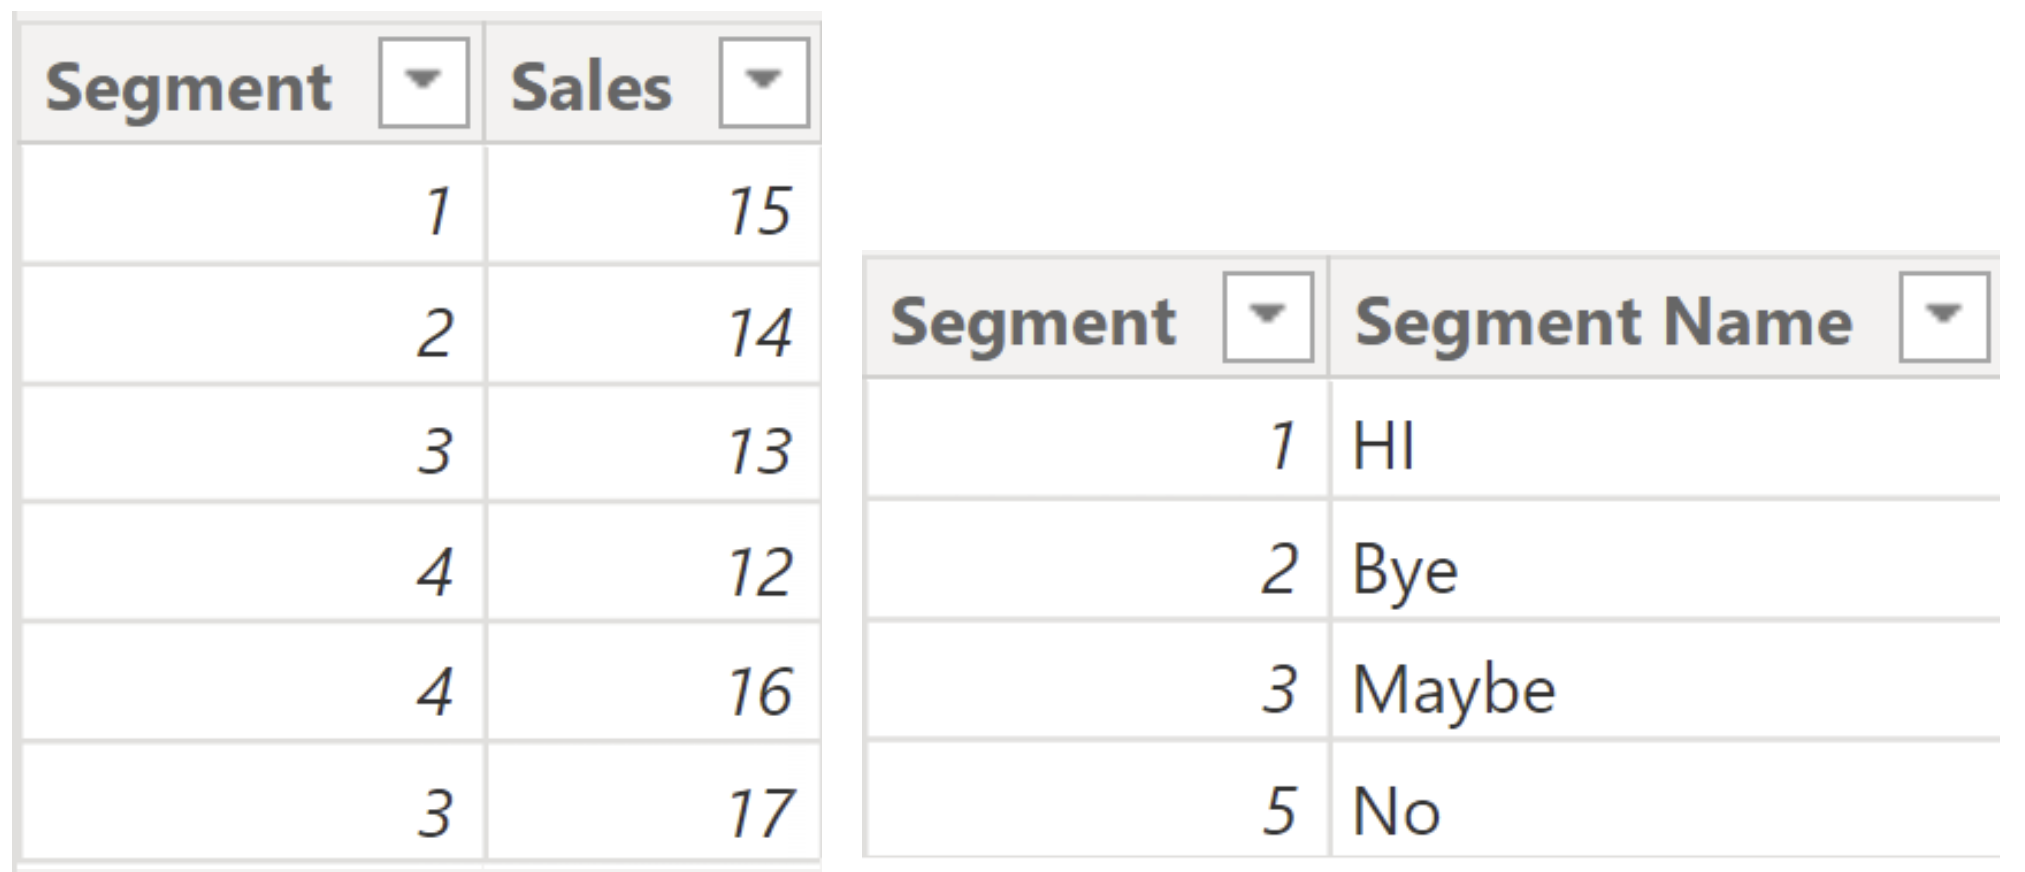
Notice that both tables include a segment which is not in the other table. We would like to build a relationship between the Segment lookup table to be able to access their names via the main sales table. There are a few options, but since there are no duplicates under segment in the lookup table, we should to cho0se the cardinality One to Many as below.
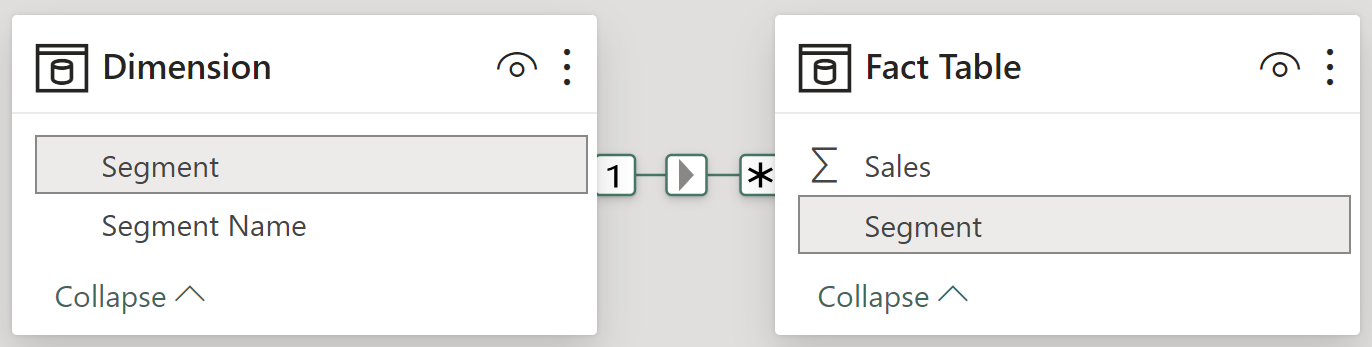
This is secretly creating a right join onto the Fact Table (the "side" part).
We can check this by building a table using Segment Name from the Dimension Table and Sales from the Fact Table:
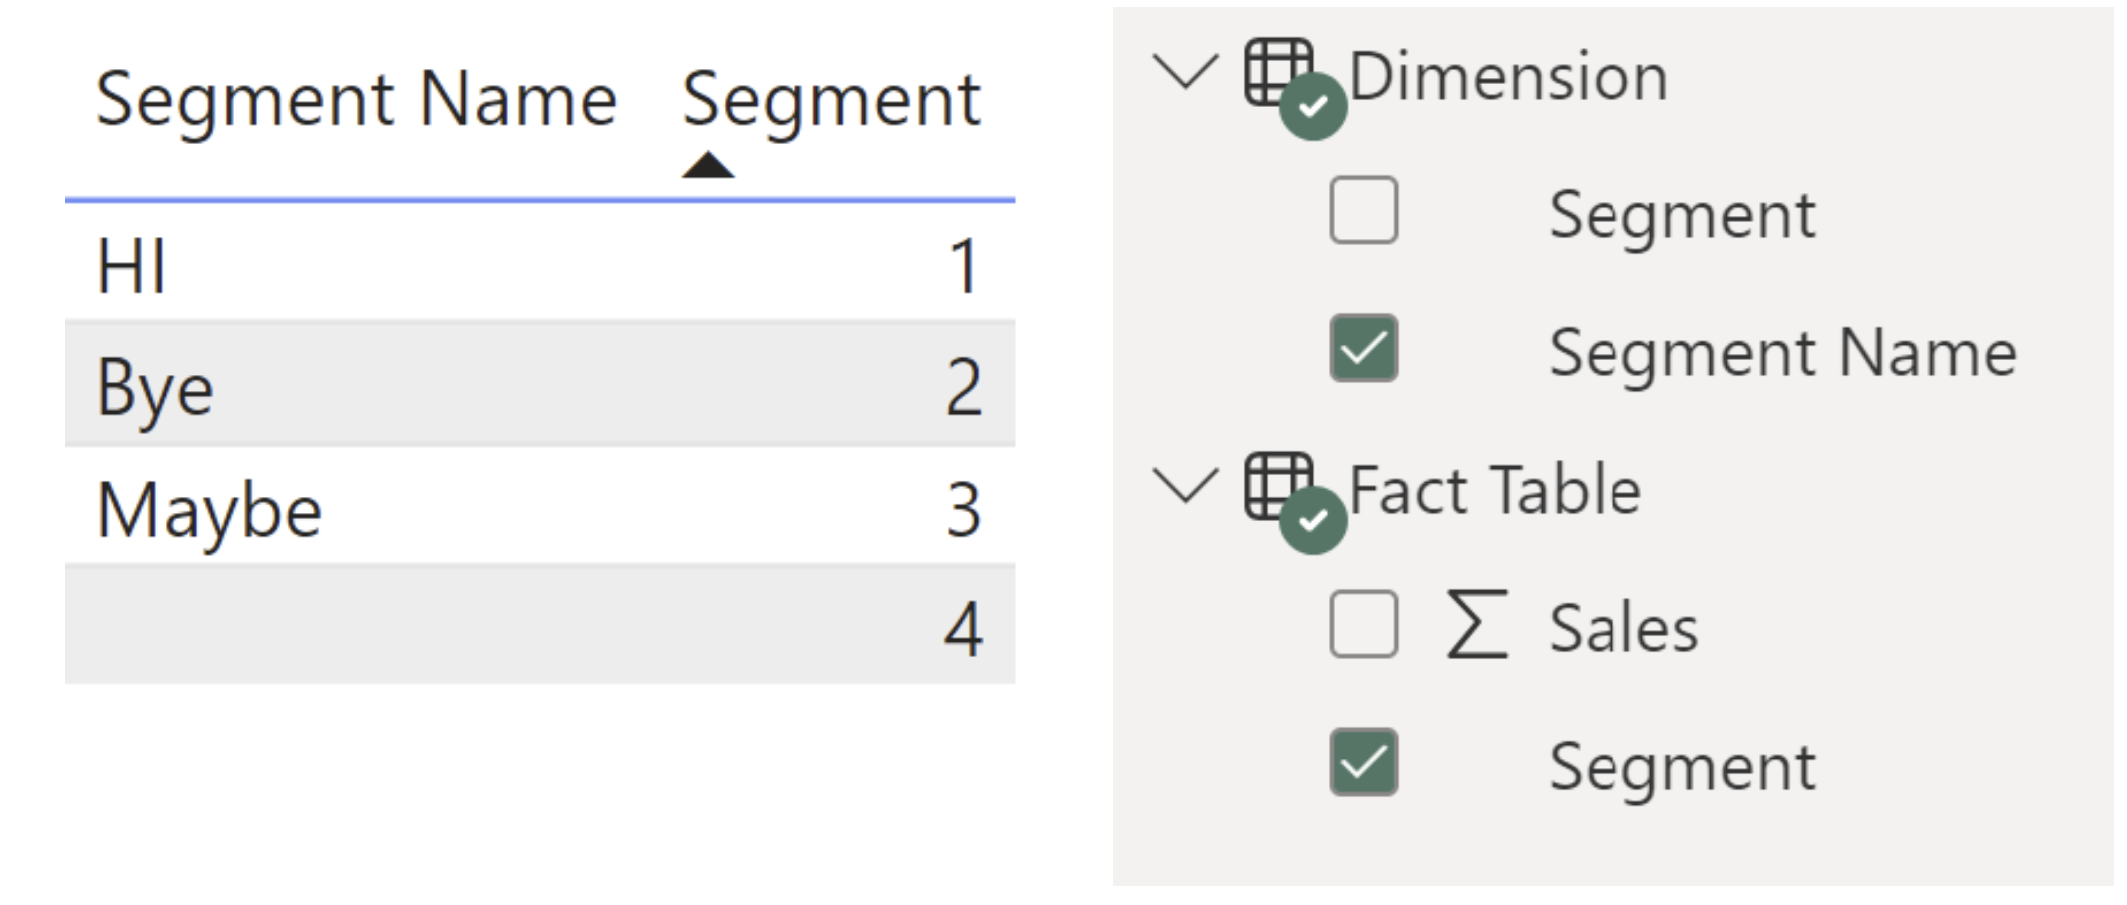
This is showing exactly what you would see if you right joined Dimension to Fact Table with join condition Segment (Dimension) = Segment (Fact Table) since it is showing Segment 4 but not Segment 5 (Segment Name "No"). We can force Power BI to use a full join by ticking "Show items with no data" in the Build a Visual settings:
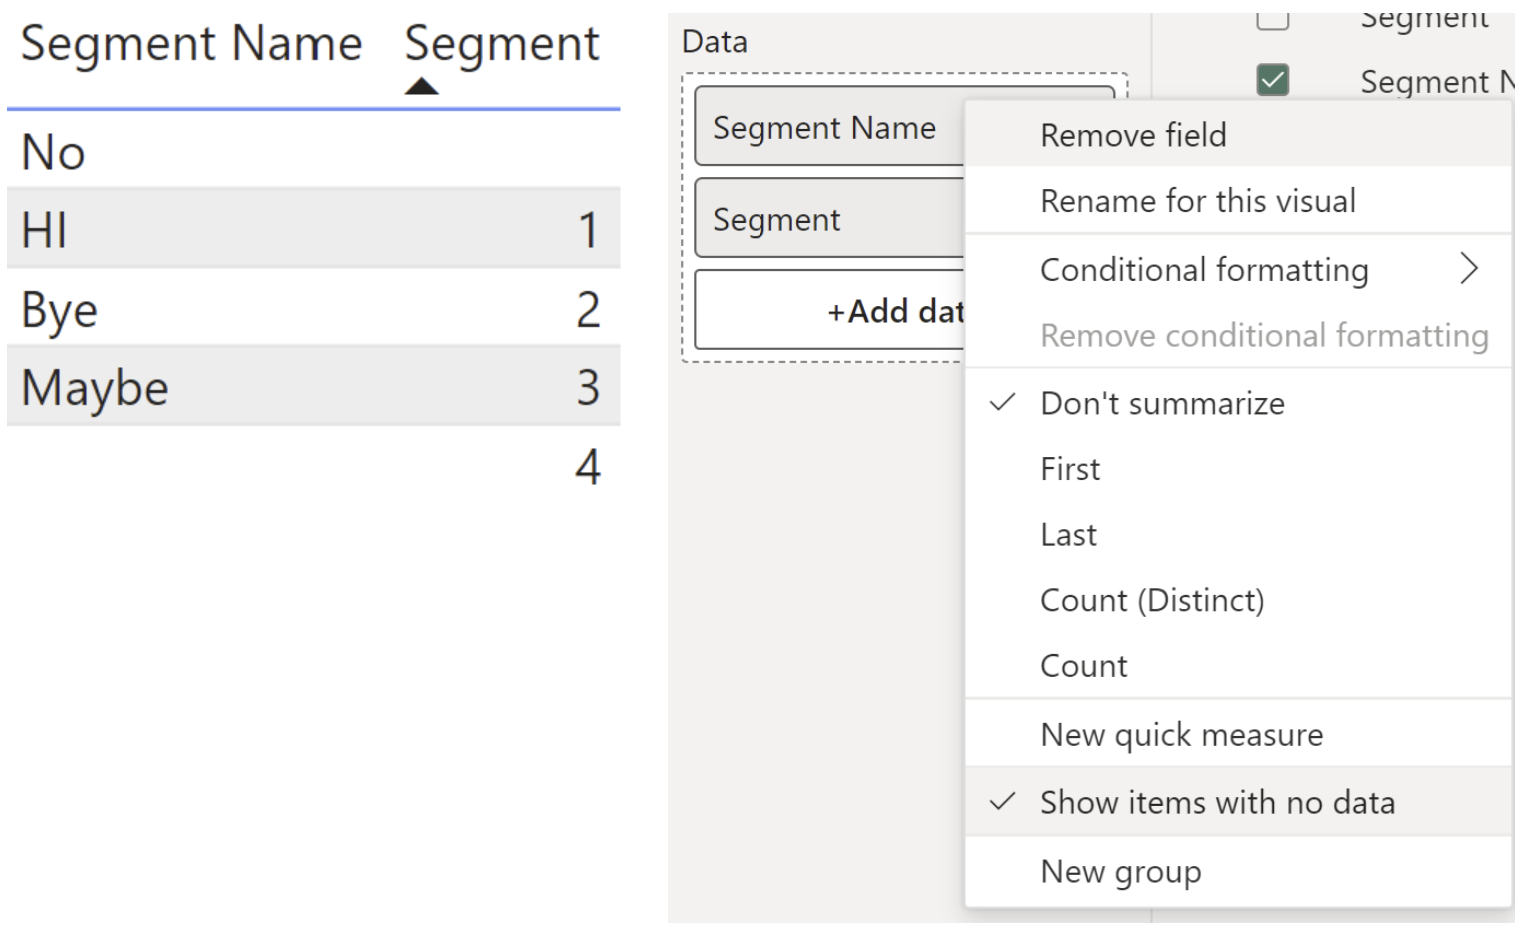
This is showing exactly what you would see if you full joined Dimension to Fact Table with join condition Segment (Dimension) = Segment (Fact Table) since it is showing Segment 4 and Segment 5 (Segment Name "No").
Conclusion:
A relationship is computing a join in the background, with the join type including the tables with "Many". This can be changed to a full join in the report view manually by enabling "Show items with no data".