


Dynamic Zone Visibility in Tableau has brought many new possibilities. One of them is Dynamic Zone zooming. Through interaction, zones expand and other zones disappear. This allows a lot of interactivity and gives the possibility to show additional information without losing the clarity of the dashboard.
In this blog I explain how to build it in 7 steps. Lets go!
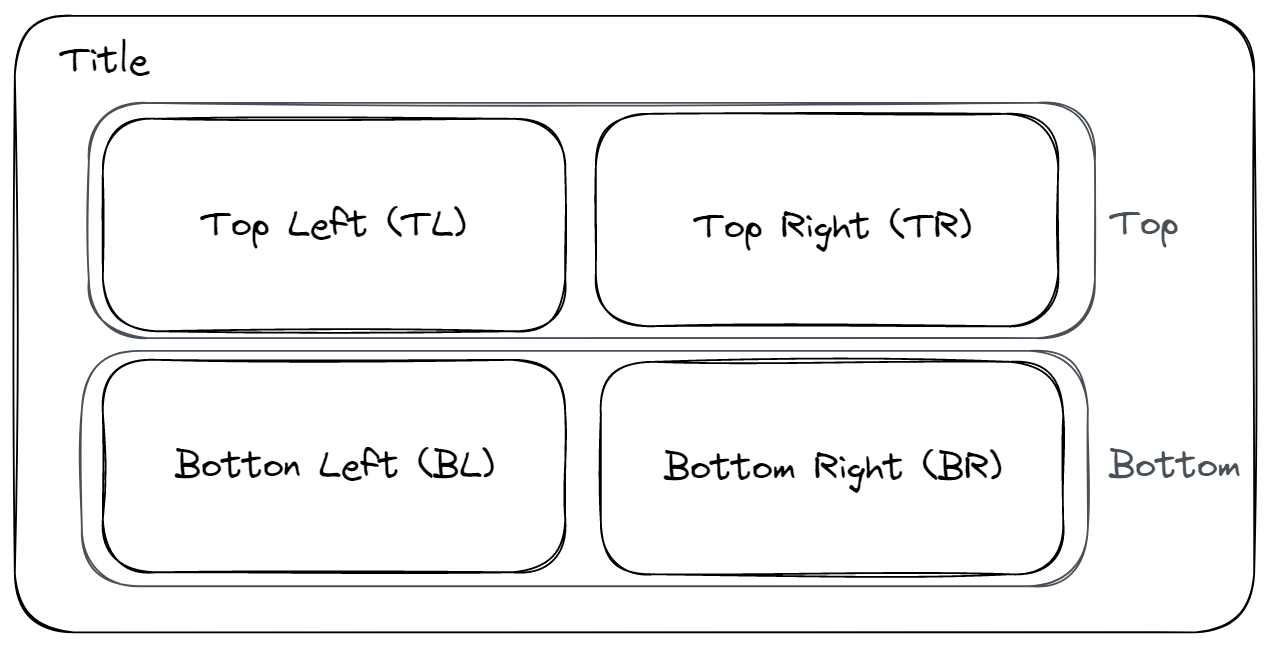
Step 1 - Create a dashboard! In this case a simple example with 4 areas.
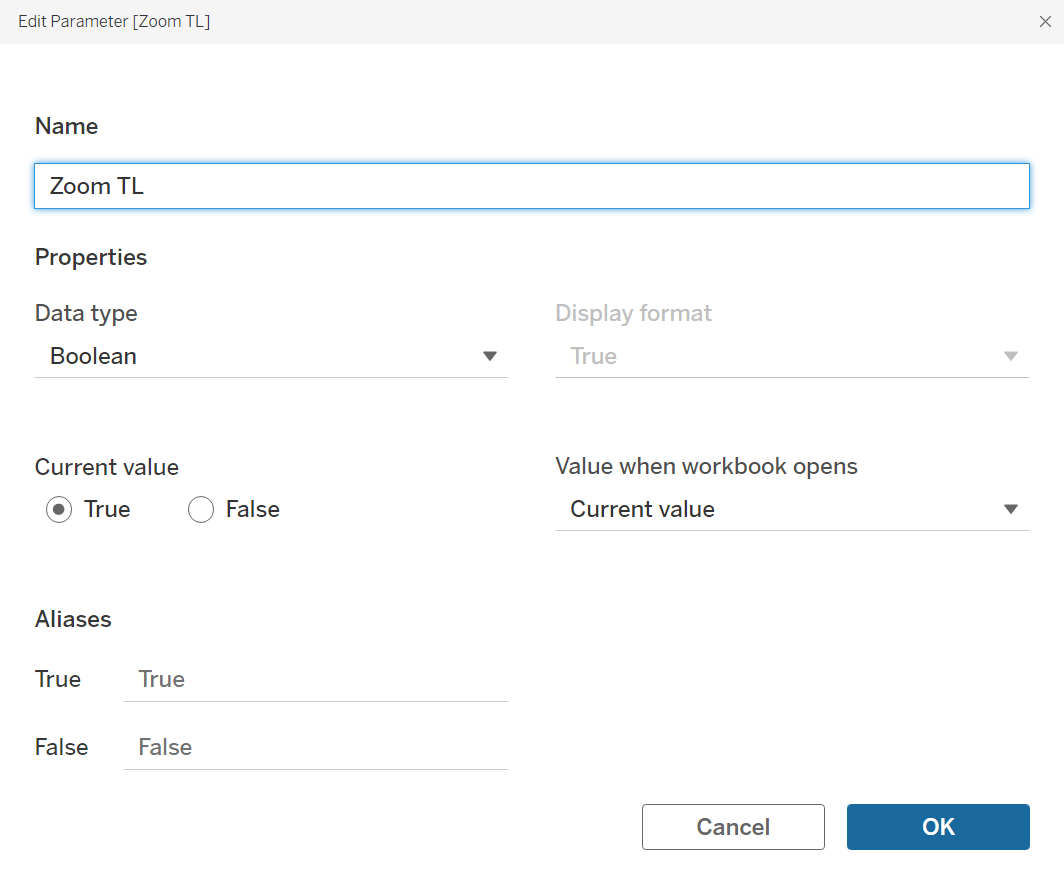
Step 2 - Create parameters for each container. In all there are 6 of them.
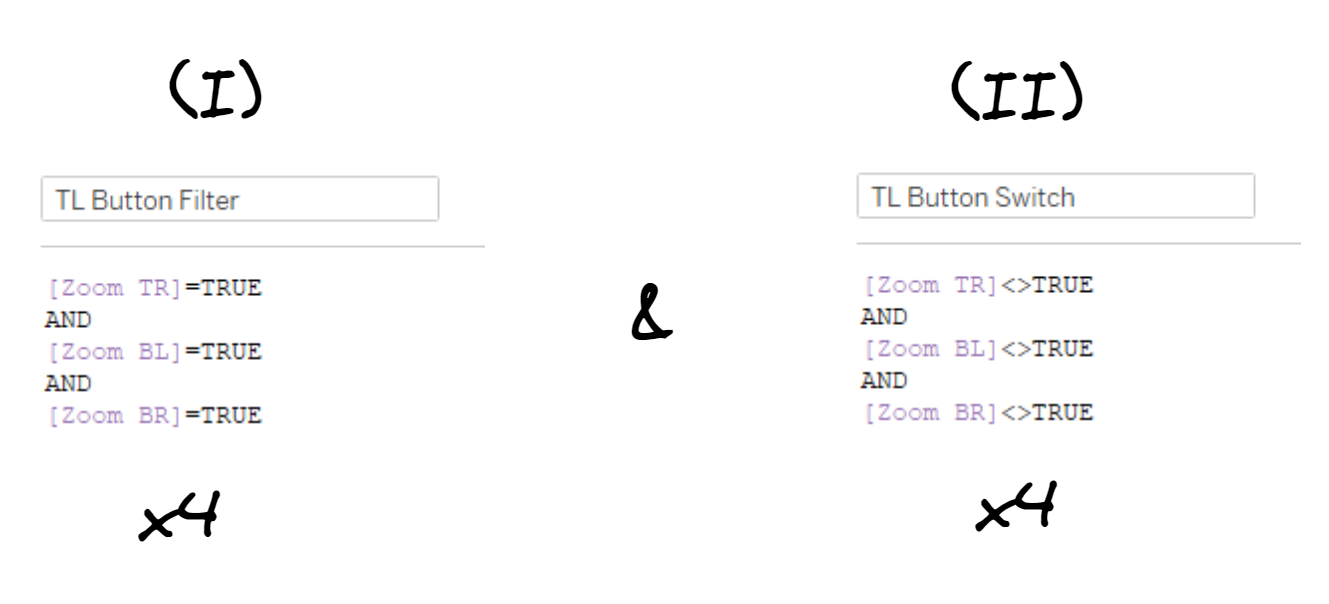
Step 3 - Create 2 calculated fields for each zoom-in and zoom-out button (TL, TR, BL, BR). That's 8 calculated fields in total.
Step 4 - Create buttons: 1 worksheet for each button, since we need one button to zoom in and one to zoom out. So we need to build 8 worksheets in total (2 buttons x 4 containers).
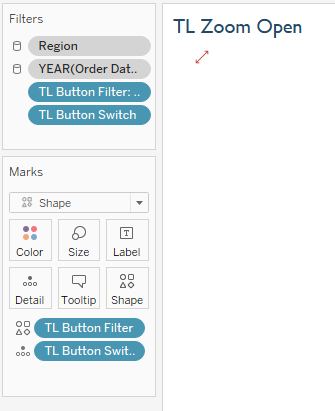
Where should the calculation fields be placed?
- Button Filter on "Filter" ("True" for Open Button, "False" for Close Button).
- Button Filter on "Shape" -> Change shape with any png
- Button Switch on "Detail
Step 5 - Create dashboard actions for each container - in total we need to create 16 parameter dashboard actions.
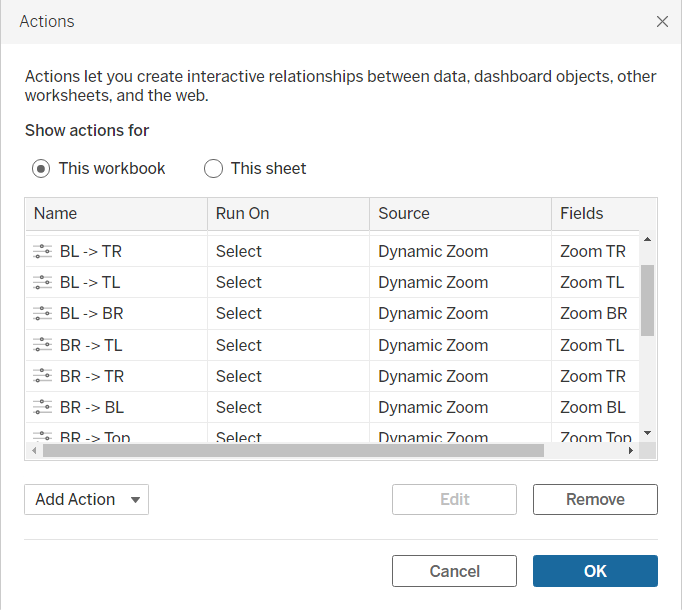
Settings of the parameter (Example TL):
- Source sheet TL Zoom Open & TL zoom close
- Run action on "Select"
- Target Parameter "Zoom TR", "Zoom BL", "Zomm BR" or Zomm Bottom"
- Source Field: TL Button Switch
- Clearing the Selection will "Keep current value"
Step 6 - Enable "Control visability using value". Again we have to do this 4 times.
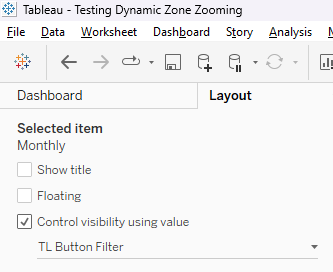
Step 7 - You can also select which elements in the container should be displayed in zoom-in and zoom-out mode. For "zoom-in" select "Button switch" and for "zoom-out" select "Button filter.
I ended up creating this dashboard, which you can download on Tableau Public. The idea of Dynamic Zone Visibility to zoom in on certain areas I got from Samuel Parsons. Please also have a look at his dashboard on Tableau Public!