


Day 1 of dashboard week was out of this world!
We were tasked with web-scraping data about UFO sighting around the world. This required a considerable amount of work on Alteryx to download and clean the data, followed by creating a Tableau dashboard to present the data.
After having a look at the data online I realised that a Batch Macro would be useful for importing and cleaning it in Alteryx. Though using a Batch Macro is not the only way of doing this, I felt like it was an area of Alteryx that I wasn’t confident in as I had only done it before while following along in class. Hence, I wanted to try my hand at making a batch macro!
Prior to creating it in Alteryx I drew down a visual representation of the logic of the macro:
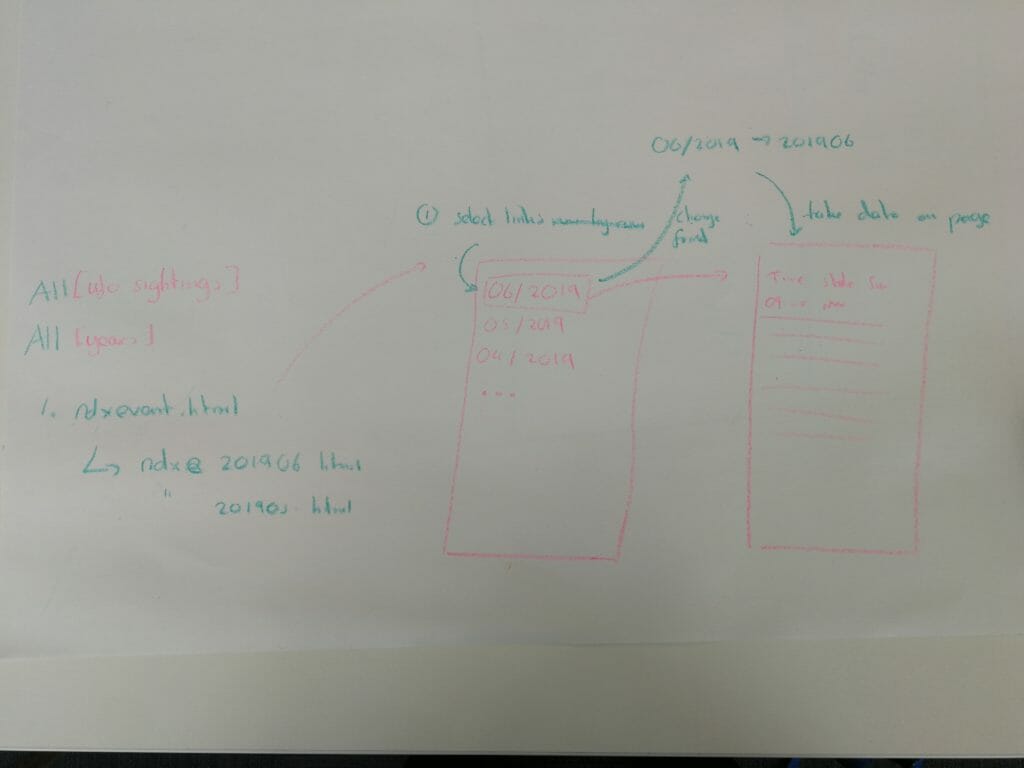
This really helped when creating the macro in Alteryx as I already knew what logic I was trying to implement.
The sketch ended up as this in Alteryx:
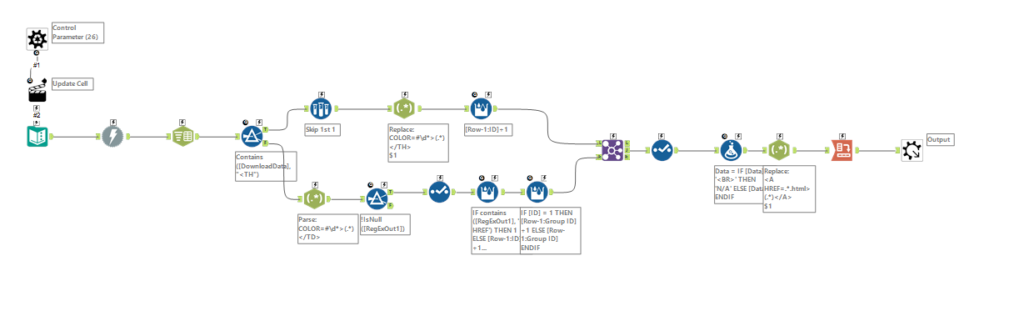
After creating the workflow and batch macro I output this as a CSV, and imported the data in a new workflow to do further data exploration and cleaning.
I ran into a few issue with dates and the sighting descriptions. This issues were inconsistencies, misspellings, and different date formats. This is a common issue when you allow users to input data as free text.
After cleaning and understanding the data a better I created a basic sketch of what I wanted it to look like.
Although the data was about UFO sightings, I wanted to see if I could come up with a “story” that looked at this data in a different way. Coming to different conclusions from the same set of data that would be valid. I came up with the idea of viewing the UFO sightings from the angle of a Alien Space Tourism Operator – making the sightings the “trips” to Earth by the company.
This ended up looking like this:
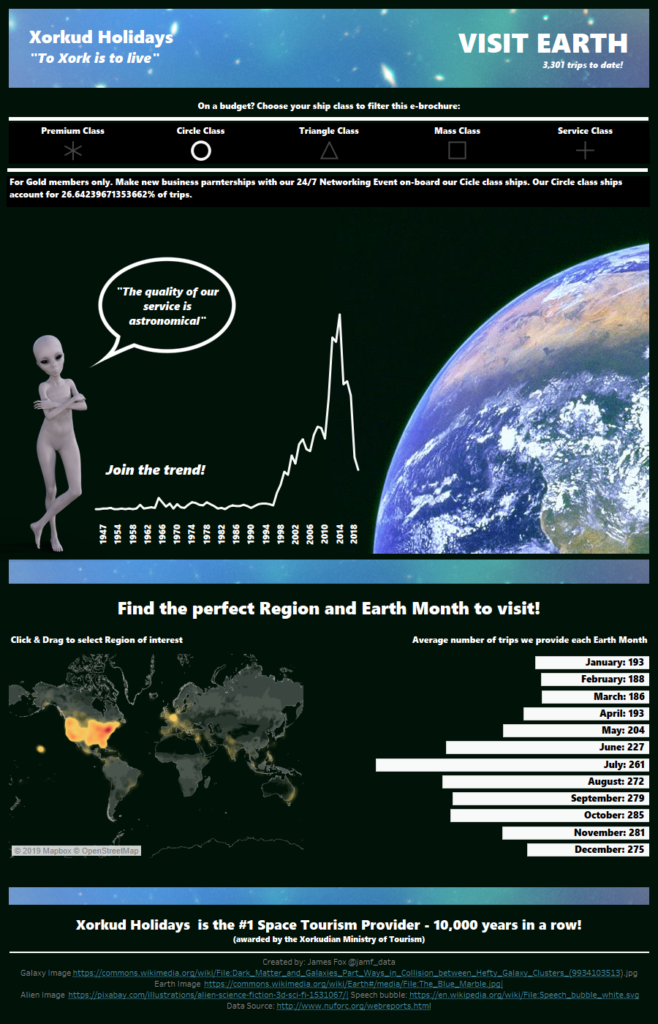
Overall I feel that the final dashboard doesn’t really adhere to the best practices of data visualisation, however I still found it great exercise to try viewing a dataset from a completely different angle.
I also finally feel confident making Batch Macros too!