


GOALS - As an NGO, you would want to explore global health information to analyse where you should focus your actions for the biggest impact. We would want to see an overview at a top level, and also some interesting insights into the biggest problem areas in global health. I have been searching for data with key worlds such as global health data, and found that the world bank provides a lot of this information. The issue is that when I download this data, it is not very Tableau friendly and I am limited to downloading from one database at a time.
Data bank source: https://databank.worldbank.org/source/world-development-indicators#
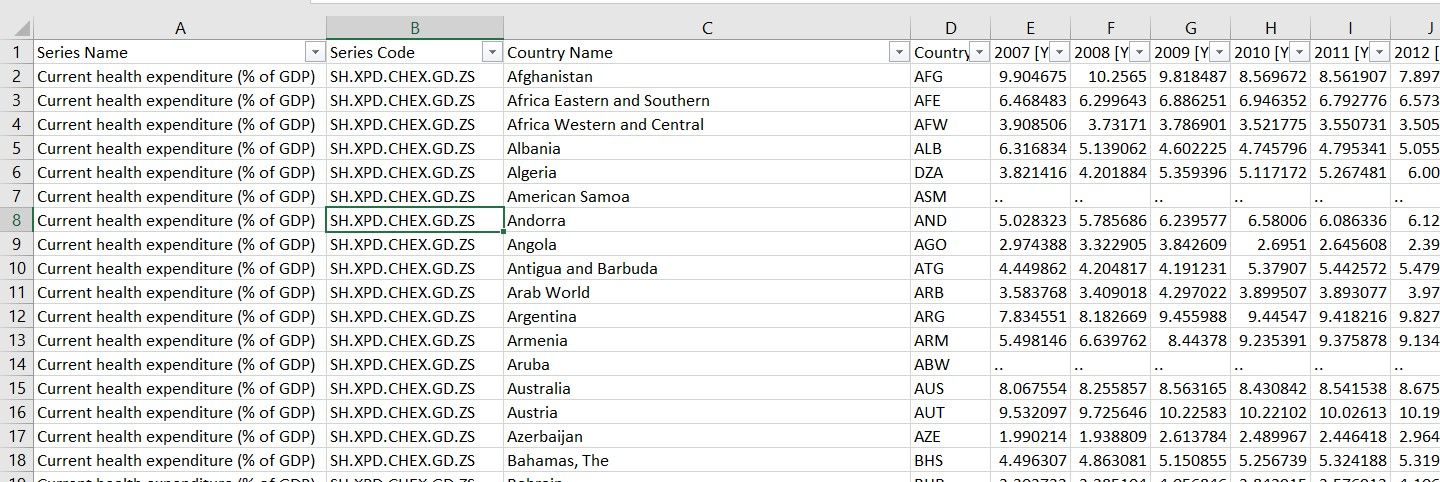
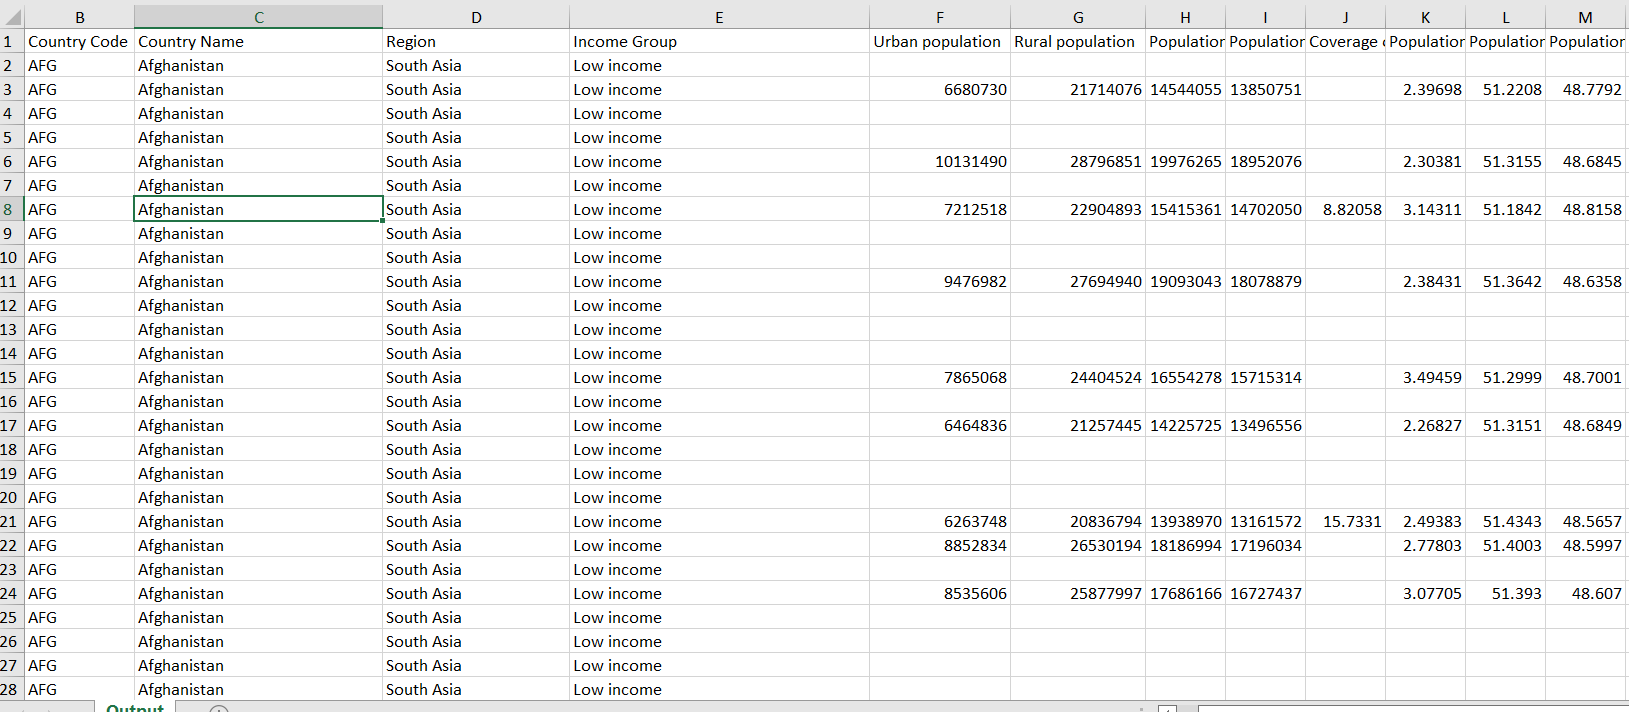
The Tableau Flow addresses these problems by first unioning all of the data downloaded from the World Bank. This allows you to combine data from multiple databases to help increase your range of analysis. The Flow will then clean all of the data placed into the file through the use of pivots and crosstabs to make the data ready for Tableau. One other problem with the data from the World Bank, is that it is un-aggregated at a Regional and income level making any analysis into these areas very difficult. The Prep flow joins in the region and income level data from another data source that matches up to the World Bank data. Another takeaway from this is that if you want to add data from another source then you can join it with the country and year fields in the Prep flow.
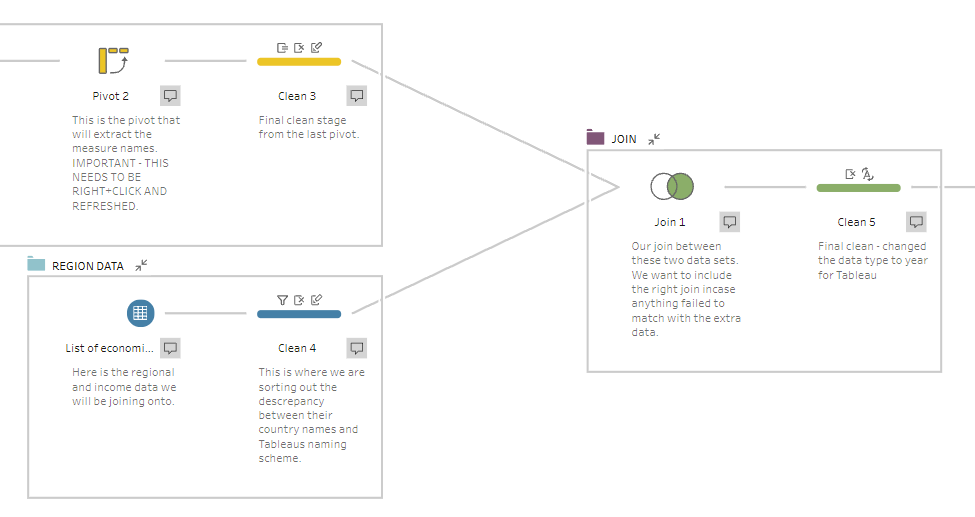
In order to use this resource, you will need to place any downloaded Excel files from the World Bank into a folder. The Tableau Prep Flow will then need to be pointed to this, allowing it to pick up and union all of the data sources. Be careful not to change the ‘Data_Extract’ in the name of the spreadsheets, as this is how the Prep flow knows to pick them up. There is one more step inside of the prep flow. You will need to right click and hit refresh on the second pivot in the first group. This is due to a limitation in Tableau Prep where the data will not refresh the pivot unless clicked. Hopefully this is something that will be fixed in the future. The output of the Prep flow will take the form of a Tableau Hyperfile, that will open straight into Tableau Desktop. Nothing more will need to be done with the data, as the Prep will have sorted it out for you.
Now that you have the file in Tableau Desktop, you can begin to analyse your data, as the multiple files will now be treated as one.
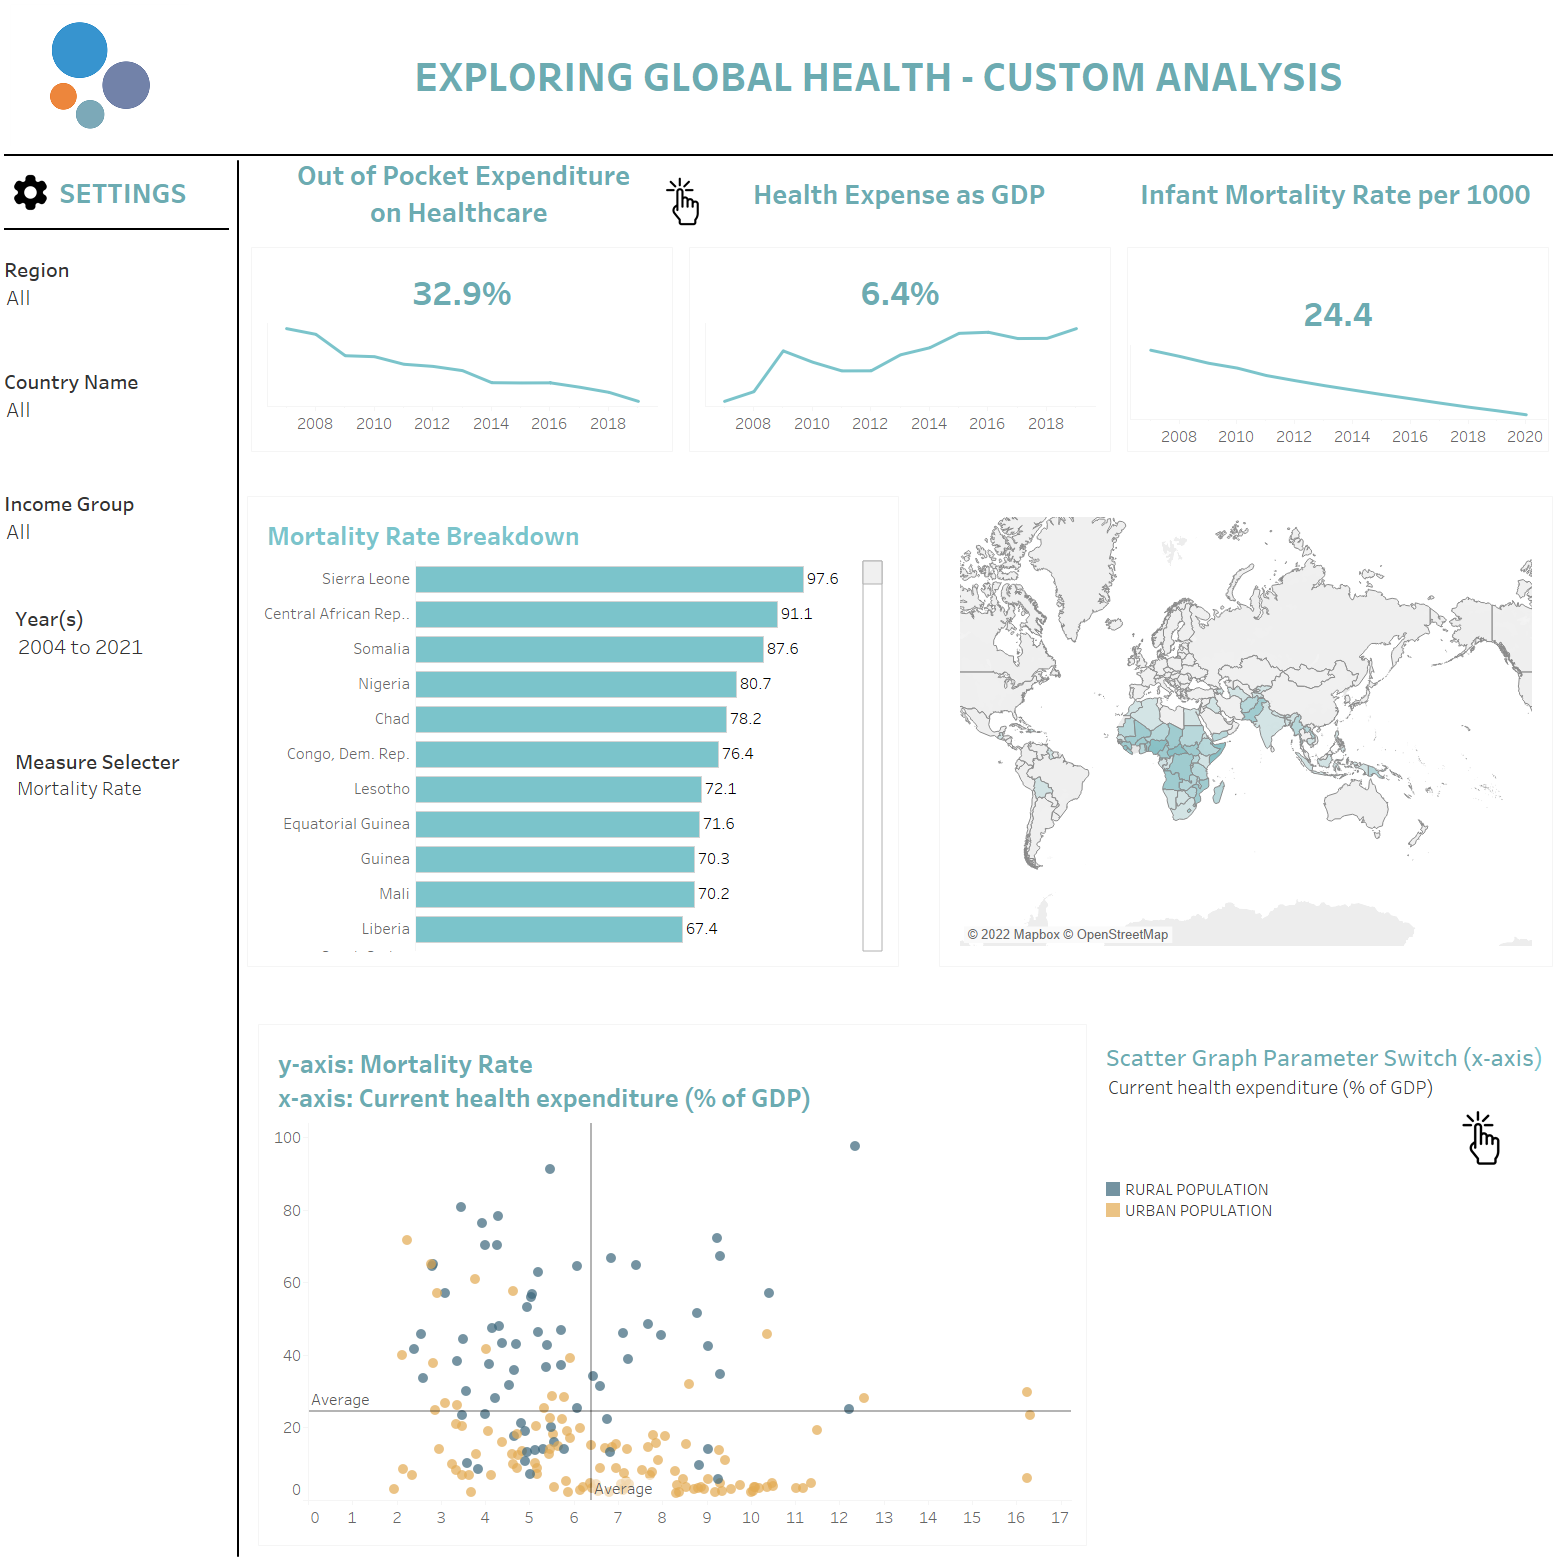
The potential outcome of this work can be derived from the union process that takes place in Prep. You can now choose any metrics from the World Bank site and easily move them into Tableau. The analysis will allow you to explore trends between databases, removing the limitations that were there in the past. The addition of regional and income data at a country level will allow for further categorization into your analysis.
https://public.tableau.com/app/profile/james.driver/viz/JamesGlobalHealthViz/Dashboard?publish=yes