Today is our first day of dashboard week, and as such we were tasked with building a dashboard around New Orleans police body cam data. The data was fairly interesting, however it was quite messy and didn't provide much use in terms of a data guide. The first issue was the size of the file and the download times as a result of this. To get around this issue, I choose to use the websites API to download certain years of data that would give a good outline of any trends over the last 5 years.

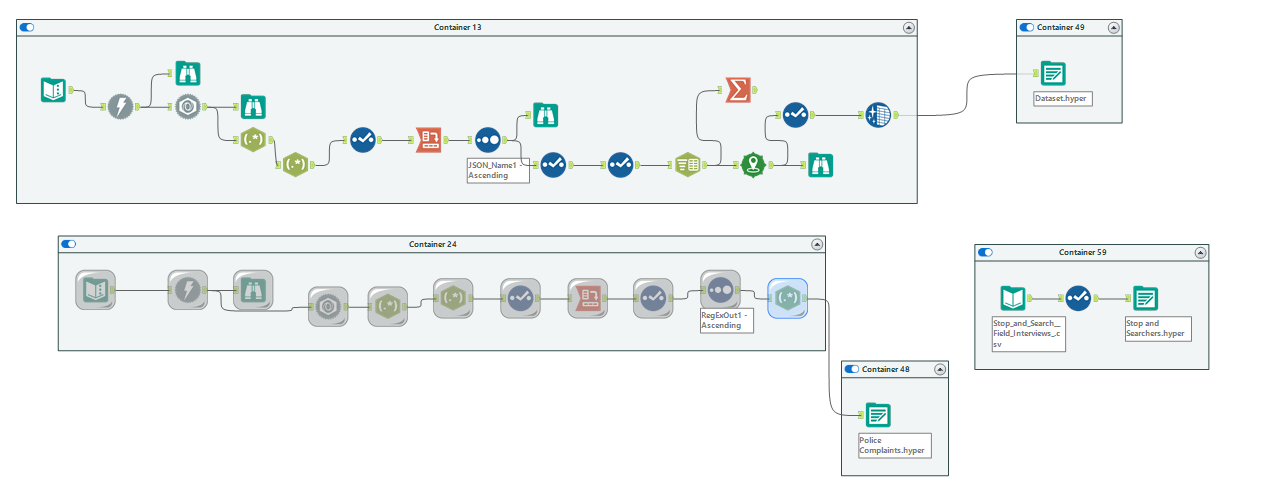
Here is the flow I ended up using, which drew an API call from two different sources of data. The data source did require an API key to remove the limit on how many records I could download, although this was easy to get hold off. The API call did start to take a while to run and highlighted the importance of caching your workflows to avoid repeat API calls. Once the data was in Alteryx and cleaned, I wanted to explore the possible impact of body cameras on altercations with the police.

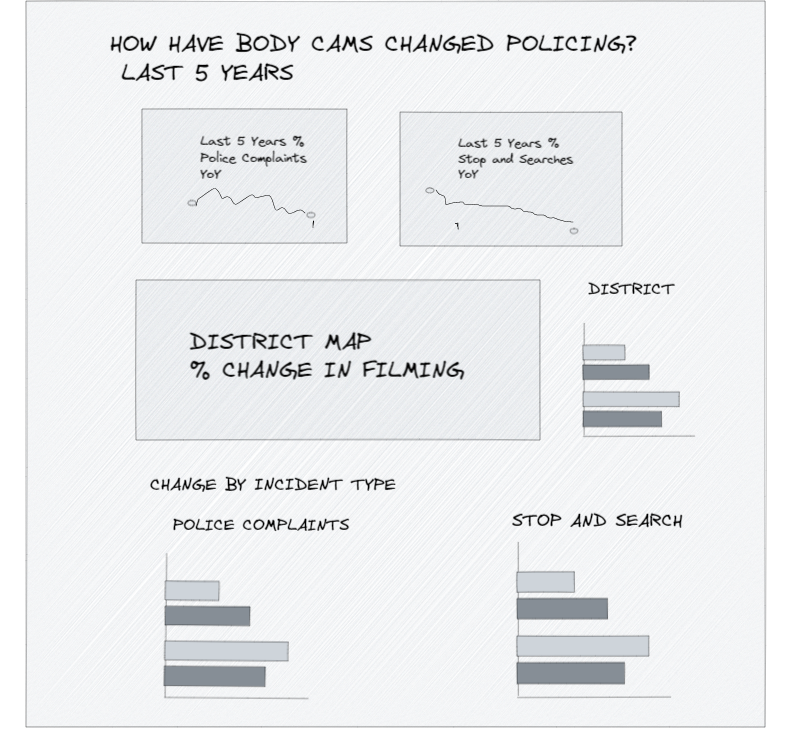
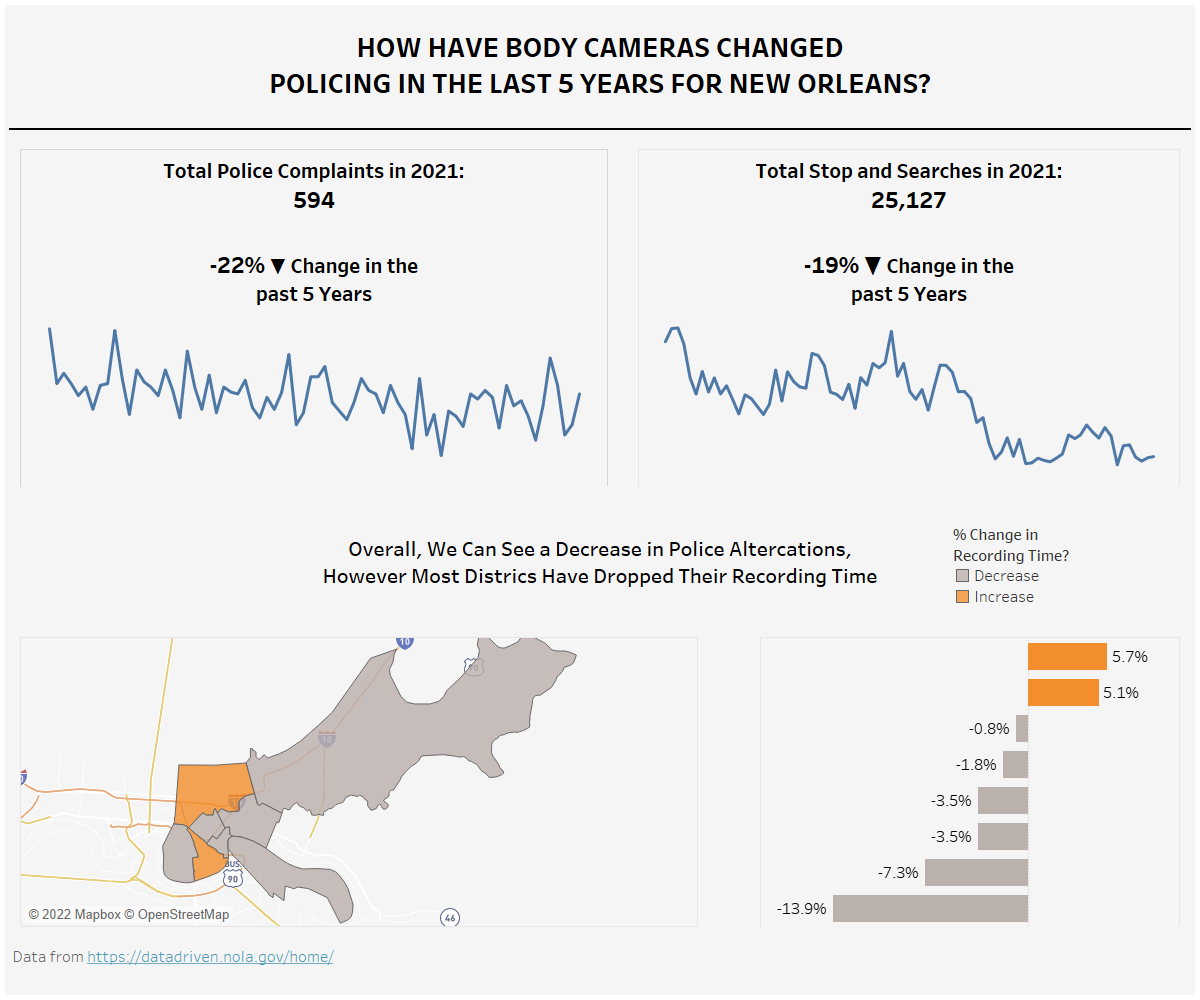
The next stage was to get an Excalidraw of my plan, and then build it in Tableau Desktop. My final dashboard can be seen below:

Overall, this was a good experience in understanding the timing for both prep and building out an analysis.
