


After we spent the whole of Week 2 working on Tableau, DS29 started Week 3 by jumping straight back into Alteryx. After our week 1 project, I'd been feeling pretty confident with what we'd learned, but after an influx of Tableau learning last week, today has definitely felt like a lot of Alteryx from Week 1 has gone in one ear and out of the other, and it was great to have a refresher on some of the more relatively complicated tools we'd looked at in Week 1: Transpose, Cross tab and Multi Row Formula.
We started off by looking at an example of how life becomes difficult for us as Tableau users when inputting data that's in a format that 'humans find easier to read'. For Example:
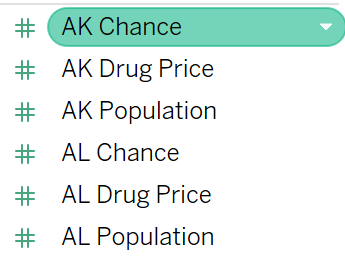
In the above format, it's a lot more difficult to use the data in Tableau, for example plotting a certain combined variable over time. In that instance, you'd need to manually create a calculated field to combine the variable across all states (something we would really like to avoid doing!)
By loading the data into Alteryx and transposing the columns to rows (use the image for the tool when you inevitably forget which is which), you can clean the data into a desired format (in this instance we also had to input a dataset to lookup state name since we didn't know what they were by just looking at postal code alone).
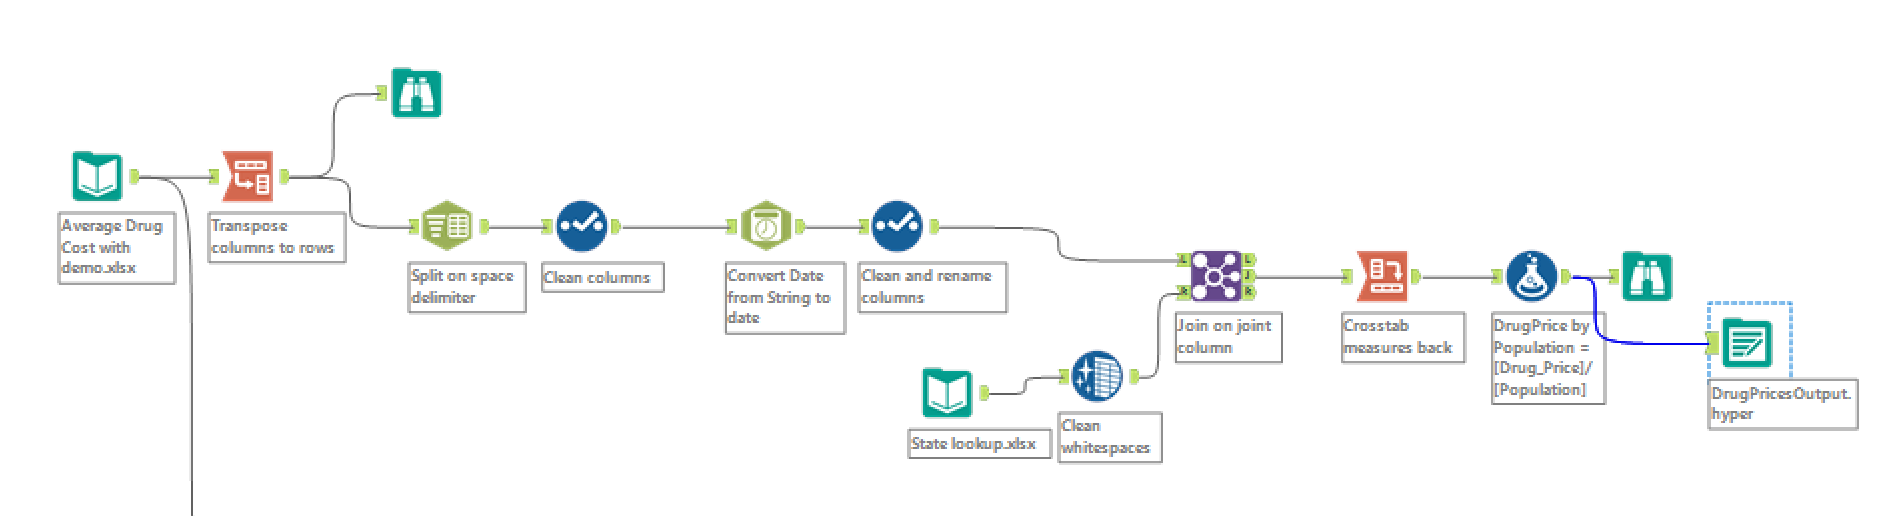
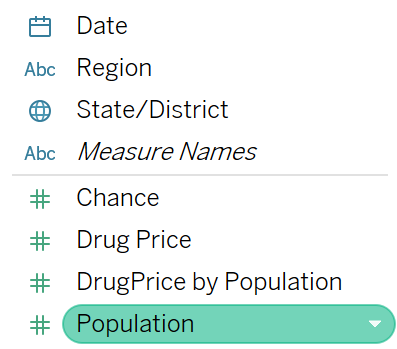
When we cross tabbed the data back and output the data to a form readable in Tableau, it became much easier to get our desired visualisations.
These tools have proven themselves to be very useful today, and while I've enjoyed the satisfaction of eventually getting each challenge right, I won't try to claim it was easy (hopefully one day I can look back at this blog and laugh at how wrong I was).