


Up until a few weeks ago was the first time I ever heard of the term “time intelligence.” On paper, it seems like something straight out of Brave New World but in the data analysis world these refer to a type of analysis we can conduct on data that changes over time. So, through Power BI, I will explain how time intelligence functions can be salient tools in Power BI.
Time Intelligence Overview
In Power BI, there are a subset of DAX functions that are categorized as time intelligence functions and they allow the user to manipulate data using time periods, which include but are not limited to: days, months, weeks, year, etc. If you would like to learn more about all the different types of time intelligence functions then check out this Microsoft Ignite page because in this blog I’ll only be going over one function.
Use Case
As a data analyst, say that you wanted to create a moving target based on the values from the previous period(s) for a given category (e.g. sales). One could use the PARALLELPERIOD() function to create a visualization that uses an interval-manipulation parameter that allows the user to compare the value of the current period to the previous period. In the following example, the period interval we’ll be using is months. (Zoom out to see full graph)
PARALLEL PERIOD Function
The arguments that this function takes in is:
- Dates or Calendar : This argument is a subset of dates specific to your data set, or, if you used the
AUTOCALENDAR()function to create a list of dates. - Number of intervals: This can be a fixed number where positive numbers indicate forward periods and negative numbers indicate prior periods. Or you can make this argument dynamic using a parameter!
- Interval: This is the argument where you define your time period such as
MONTH()orYEAR()
For this dashboard, my expression is as follows
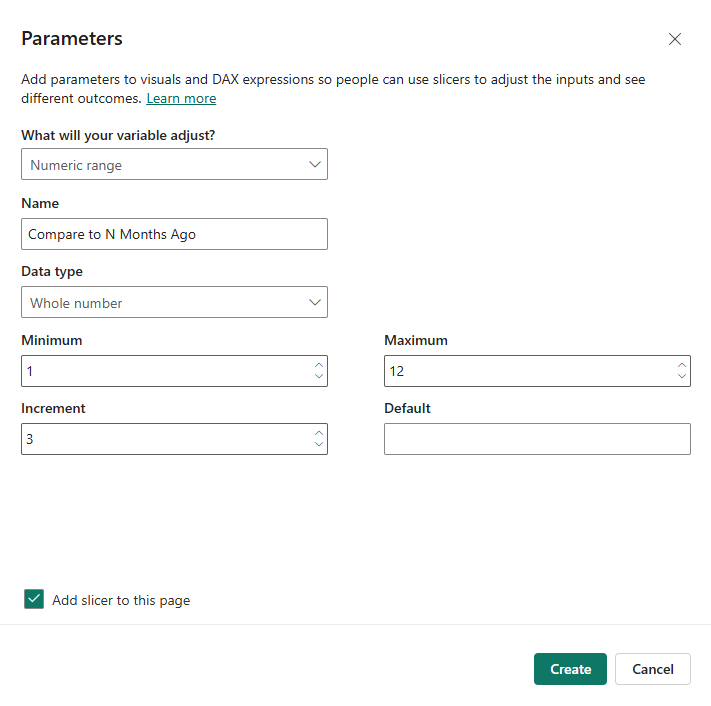
My second argument SELECTEDVALUE('Compare to N Months Ago'[Compare to N Months Ago]) is a parameter I created using the following steps:
- In the modeling tab, select New parameter and pick "Numeric Range."

- Rename your Parameter. Since I am looking at previous months I renamed mine to Compare to N Months Ago
- Set your range and Increments! Again, since I’m looking at months my range was 1-12
Dynamic KPIs
Switch to page 2, The following dashboard has two KPIs, one static that only looks at sales for the month of December and compares it to the sales of December last year. The second one is dynamic where, once again, we are looking at sales for December but using the parameter we can change the goal using sales from N months ago! Then the percentage difference changes accordingly depending on if sales in December are under or over the Nth month.
For reference, the table on the right is a sanity check. Play with the parameter and check for yourself!