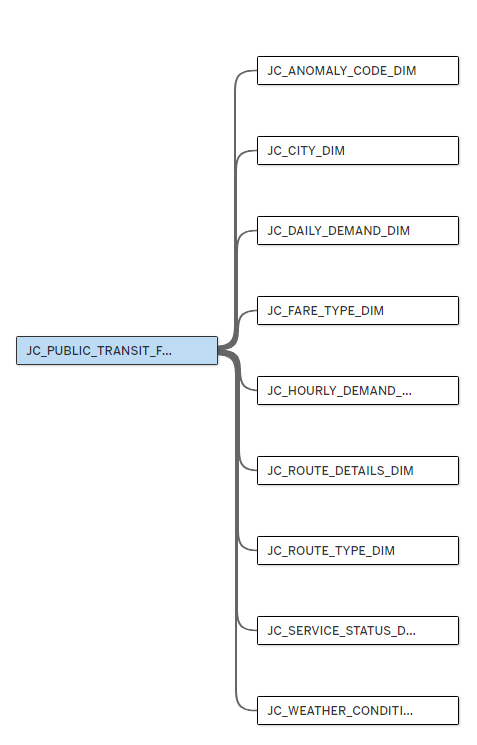
In one of my previous blogs I explained how the comprehension of data structures is critical to the data cleaning process. In this blog, I will expand upon some of those concepts through a data modeling project I recently completed. I had the opportunity to build a data pipeline from Snowflake to Tableau using SQL and it was a culminating experience that allowed me to hone in on my data engineering skills and visualize the bigger picture of the data pipeline.
Overview
For this project, there were four major components:
- Pick a dataset of your choice, we could acquire the data any way we wanted to: open source libraries, web scraping, mocking data etc.
- Build out a schema of fact and dimension tables meant to optimize querying speed and storage. Then prepare two different schemas for two potential users of your data source.
- Create the tables from the schema in Snowflake using DDL and DML commands
- Connect the Snowflake Server, build out your schemas and publish both data sources to Tableau Server.
The dataset that I selected for this project was a Public Transportation Usage dataset from Kaggle. The dataset contained roughly 6-16 public transit routes (of different transit modes) for 6 different cities across the world. For each route and city, on every hour of every day the usage of that transit mode was measured. These metrics included measures such as: boarding count, alighting count, occupancy rate, etc. Altogether, this dataset contained 500,000 rows! Good thing there wasn’t a limit on datasets we could use in the project.
Additionally, I developed two user stories to help drive forward my analysis as I began developing my schemas. They were:
- MTA Operations Specialist: As an MTA operations specialist I want to know how to improve the efficiency of my trains to increase choice ridership:
- I can do this by understanding the frequency of rail cancellations.
- I can do this by understanding the margin of actual arrival time vs scheduled arrival time.
- London Urban Policy Expert: As a London urban policy expert I want to know which mode of public transportation has the highest demand so I can properly allocate my budget:
- I can do this by analyzing passenger counts for specific routes.
Schema
Developing my schema was, arguably, the crux of this project because, with 31 different columns of various data types, I had to consider how I should organize my tables in a logical way that mitigates duplicate rows and optimizes querying speed once I connected my tables to a BI tool. Furthermore, since I developed two different user stories, another consideration I had to make was separating my tables based on user needs. The MTA Operations specialist doesn’t necessarily need the same tables as the urban policy expert in London. In the end, I created the following schema:
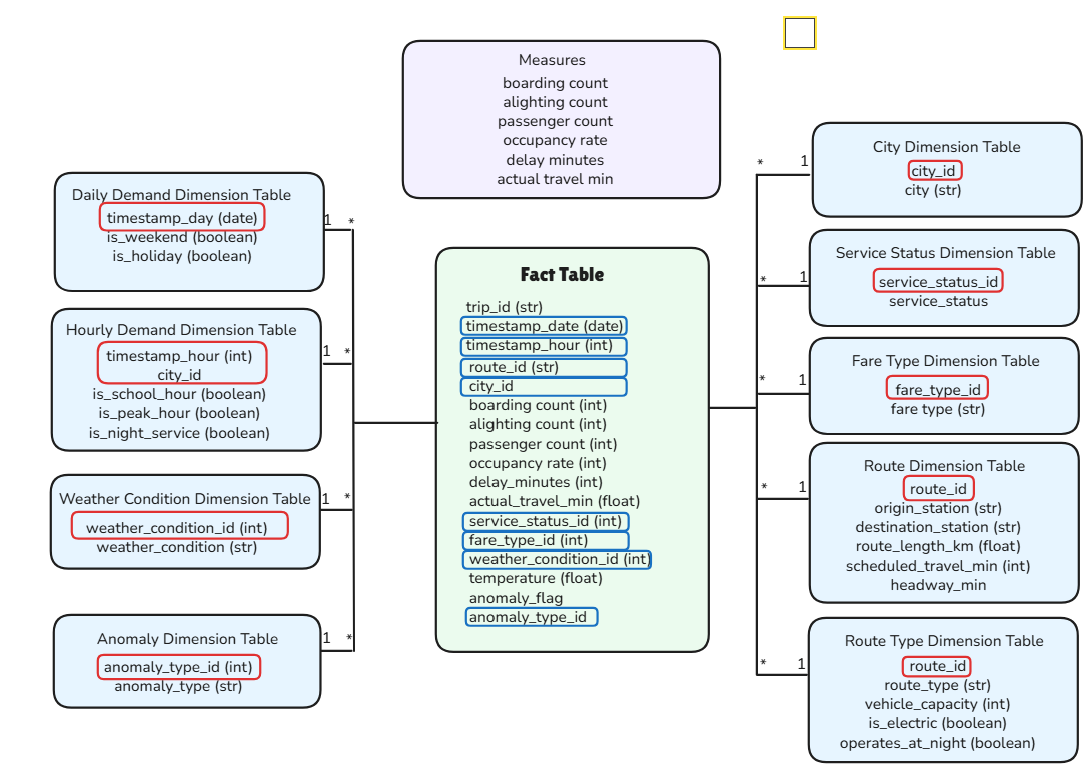
A significant number of my dimension tables I would need to end up creating a unique id for all the string values that don’t already have one, such as service_status. My reasoning behind the creation of lookup tables is to reduce querying speed once my data source is uploaded to Tableau. Integers are parsed faster than strings so if we replace the repeating string values in our 500,000 row fact table with integer codes then we can execute queries faster.
Additionally, I had to make a concession on my hourly demand dimension table and slightly explode the data by adding city as another key. However, this is a change I had to make after creating my tables in Snowflake which I will expand upon more later in this blog.
Snowflake Tables
After sketching out my schema, I had to import my raw data into Snowflake to begin creating my fact and dimension tables using DDL commands. I wanted to ensure that I had constraints on my tables so I defined my primary keys in my dimension tables. However, I did not define all my keys in my fact tables. So, in the next steps section, I will discuss how I could have written more sophisticated scripts. However, an example of one of my dimension tables is below:
create or replace table JC_Route_Type_Dim(
    route_id varchar(50) PRIMARY KEY
    , route_type varchar(50)
    , vehicle_capacity int
    , is_electric boolean
    , operates_at_night boolean
);insert into JC_Route_Type_Dim(
route_id
, route_type
, vehicle_capacity
, is_electric
, operates_at_night
)
select
route_id
, route_type
, vehicle_capacity
, IFF(is_electric = 1, TRUE, FALSE) as is_electric
, IFF(operates_night = 1, TRUE, FALSE) as operates_at_night
from
JC_RAW_DATA
where
trip_id is not NULL
group by
all;Blockers/Areas of Improvement
As mentioned earlier, I had to add two keys to my hourly demand dimension table because the blocker I ran into was with my Boolean condition in my is_school_hour field. My expectation for the hourly demand dimension table was that it would be 24 rows, one row for each hour, that I could logically relate back to my fact table. This was the case with my daily demand table (365 rows), and, perhaps I got lucky that the holidays were the same across all the cities because the reason why my hourly demand table was coming out to 32 instead of 24 rows was that both my Boolean conditions were satisfied for this is_school_hour field, leading to duplicate rows:
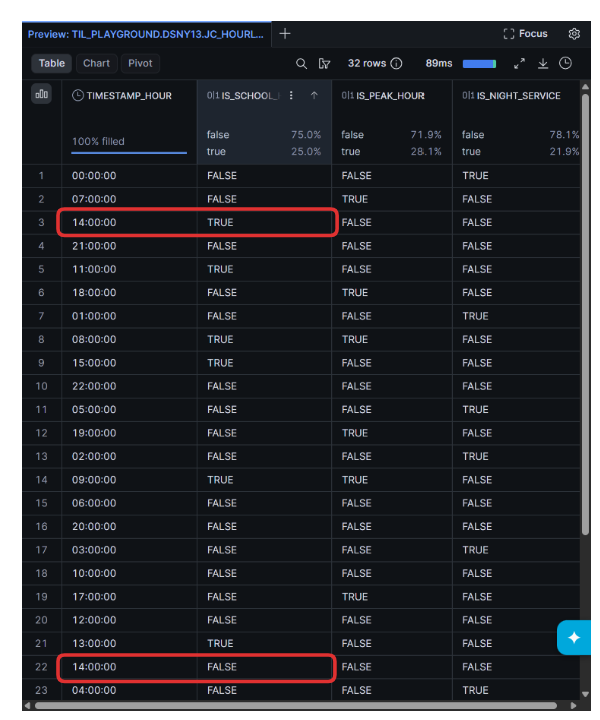
This duplication happened because in different cities around the world they have different school hours, so when I ran this query statement there were instances where Snowflake may find a 1 (indicating TRUE) in one city but 0 in another. I rectified this by slightly exploding my data with the addition of the city_id granularity. Thus, each city would have 24 rows, with hours 0-24.
My last two considerations have to do with my SQL code. I used the dense_rank() window function to generate my unique ids for all fields that I created one for but I found myself repeating the same line of code in each table I created. I validated that my codes in my dimension tables matched the ones in my fact table by ordering them in ascending order (alphabetically), but in future cases it would be wiser to have one source of truth. I could have done this by creating a CTE or subquery and joining the singular CTE to all the tables that used it so I had one source of truth. Lastly, I could have tighter table constraints such as defining my primary keys in my fact table.