Day 4 had us webscraping the London Marathon Results and building dashboards based on the data. Full Details here: https://www.thedataschool.co.uk/andy-kriebel/ds28-day-4
Again we just had the day to do this and most of it was spent sorting out the RegEx required to webscrape.
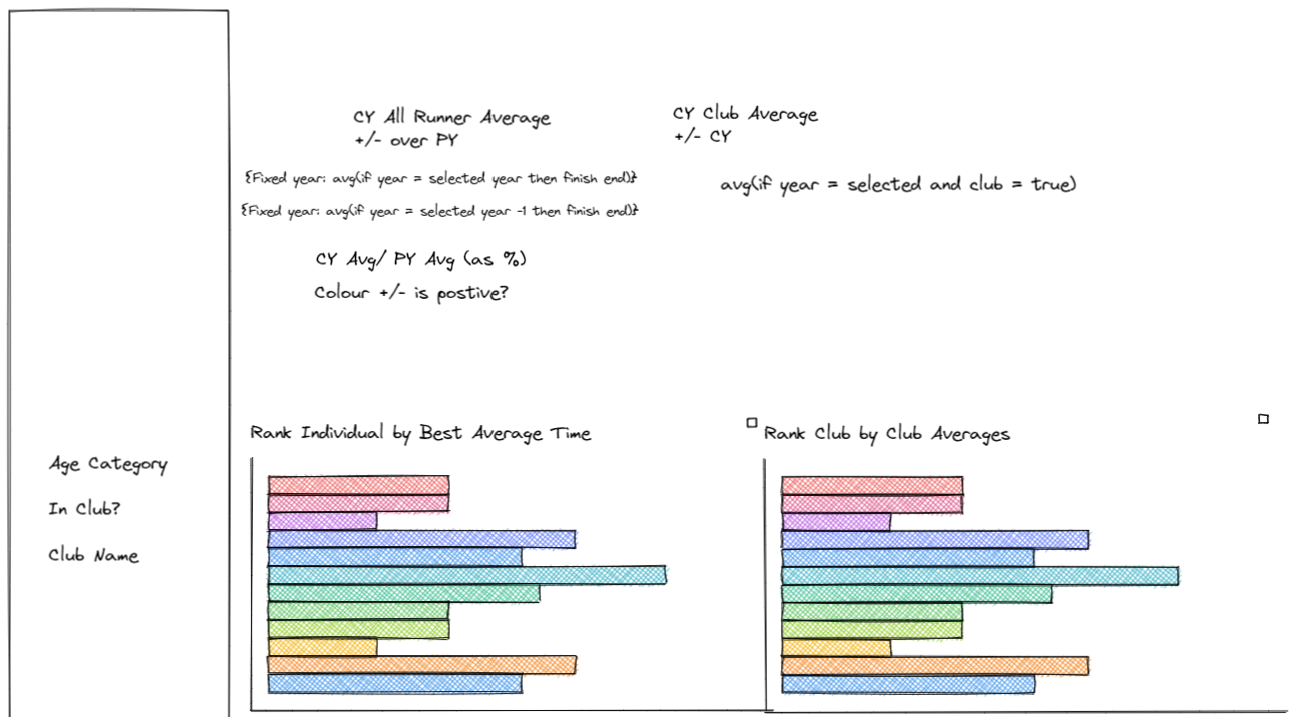
Here was my dashboard plan

The top had some BANs and then some charts at the bottom. Not overly complicated but my planning did include LOD calculations which would prove incredibly helpful as it took almost the whole day to prep the data.
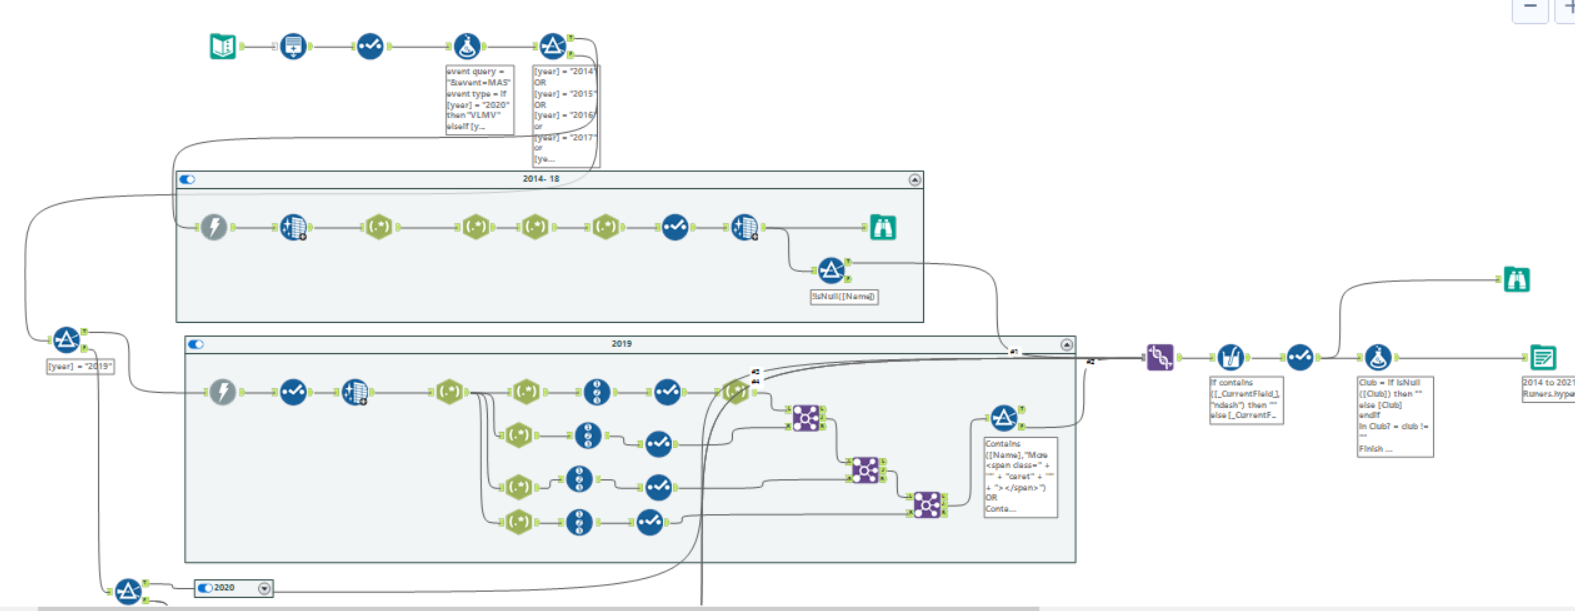
Here is a snapshot of my Alteryx Flow

The flow involved downloading the HTML, and REGEXing the hell out of it. 2014 - 2018 followed the same HTML Structure but 2019, '20 and '21 had different HTML so required separate 'streams' to handle it. Once cleaned, a simple union pulls everything together.
Here's what the data looks like:

In the last hour of the day I rushed to pull my dashboard together - thankfully my plan meant I could build out the sheets very quickly.
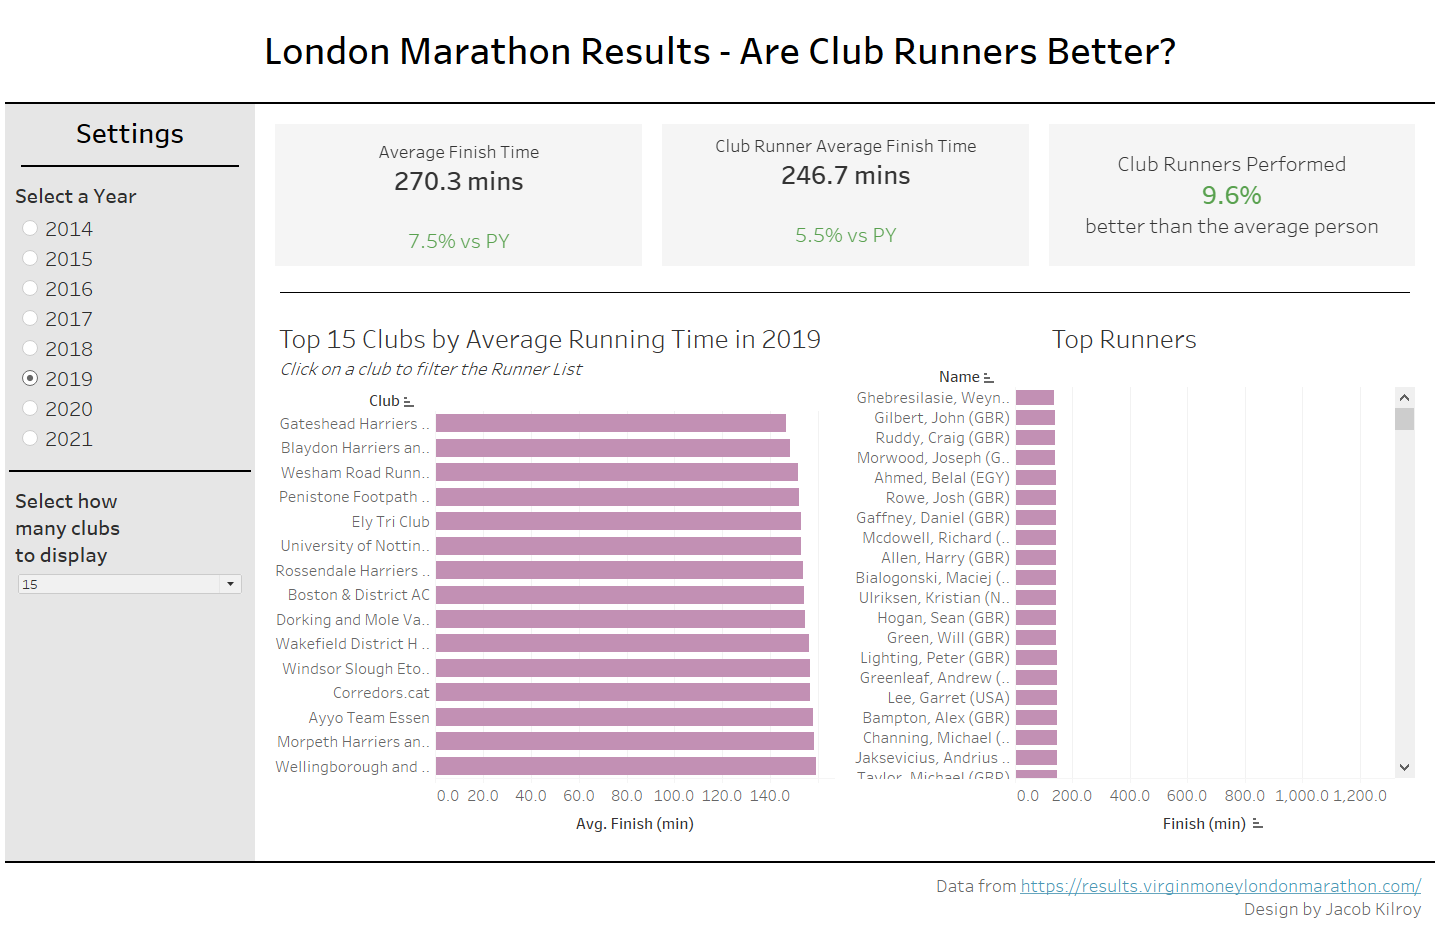
Here is my final dashboard

Overall, happy with how it came out. I'm pleased that I could create LOD calculations in such a short time and the dashboard does answer a niche question that may be useful to someone.
