


Today's training challenge was to find a large dataset of our choice and convert it into a schema, build the schema, and publish it for future use. This task is unlike most of the work we have done with schemas in training. Usually, we either get a big table to visualize, or a set of smaller tables to relate before we can visualize.
Taking the big table and going toward the smaller related tables felt like "going backwards" in comparison, but this process can be enormously beneficial for performance. Instead of dealing with thousands or millions of rows, the schema model consolidates a table into a fact table with key information that makes each record unique, and a set of dimension tables that hold static information. This way, calls are only made to the dimension tables to get the information that is being immediately requested, saving a whole lot of memory and computing time.
As convenient as it would be to have one, there is no algorithm for separating a wide table out into a schema. Subjective decisions are actually an important part of developing a schema that will make sense to others! Since this was my first time trying to do this "backwards" process, I went through a few iterative steps (and asked for help along the way). This blog will follow my meandering process towards my final solution!
Phase 1: Find a Dataset
This was one of the only times in training that we had the open ended opportunity to pick a dataset of our choice, on any topic. I made sure to take advantage by selecting an area that interests me personally, Broadway shows! There are many Broadway datasets out there, but they were often restrictive or small. The ideal table for this kind of task is one that has multiple fields that give each row its uniqueness, so the associated details can be split out into their own dimension tables. Ultimately, I landed on https://openbroadwaydata.com/data.html and chose their "General Use" dataset. This data had promise because of its complex granularity – each row represents one role, held by one person, in one show, in one year. This is a good amount of complexity needed to build out a robust schema!
Phase 2: Breaking up the Fields
I was not quite sure how to start heading towards a schema, so the first thing I did was group the fields (columns) into topic groups. For example, I organized everything that had to do with a person's identity into my "people group", and so on from there:
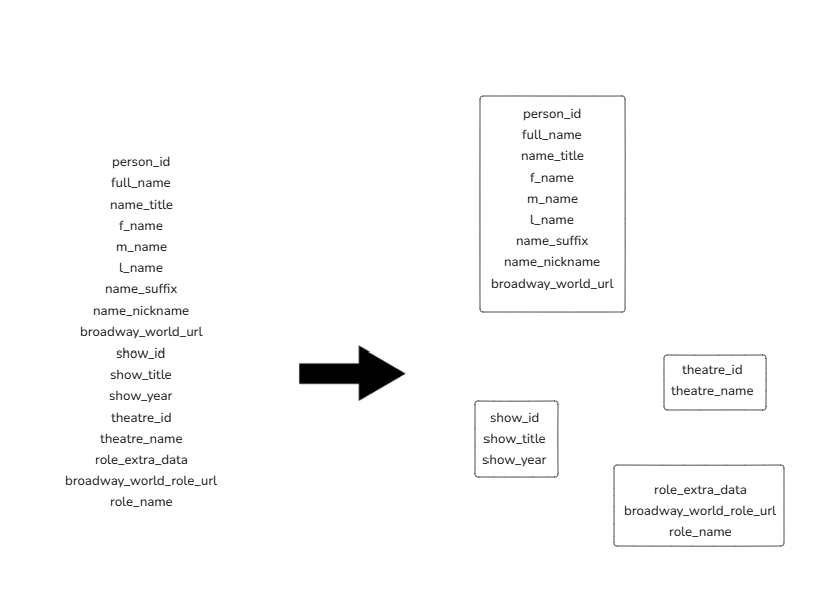
This is a way of organizing these fields, but it does not achieve the goal of querying efficiency that was the entire aim of this task.
Phase 3: Facts and Dimensions
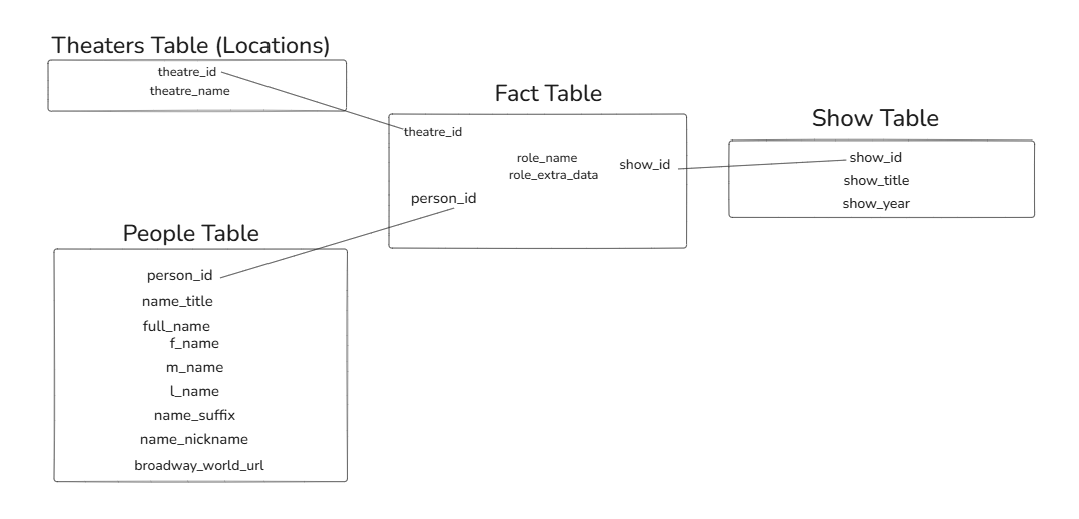
Next, I worked to separate out these groupings into the fields that belong in fact tables, and the others that should be placed in a dimension "lookup" table. A good rule of thumb here is that fields with "ID" in them are likely to be fact table fields, as they are often (but not always!) programmed to be unique for each instance of the value that they are identifying. Since I wanted unique people, shows, and theaters in the fact table, I placed person_id, show_id, and theatre_id into the fact table first. The role information was a bit trickier to incorporate. Since there is no role_id included, I had the choice of creating my own (likely in SQL) or including role information as part of the fact table. Since the fact table was minimal anyway and this would only add 2 fields (I chose to exclude all URL fields), I went with adding role information to the fact table. My final schema looks like this!
Phase 4: Bringing my Schema to Life
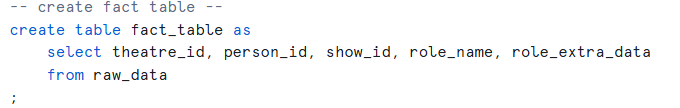
As valuable as it is to conceptualize a schema like this, the only table that really existed at this point was the original raw data. In order to build the fact table and dimension tables, I used SQL within the Snowflake environment, selecting the necessary rows from the original data table to create the sub-tables. The query I used to create my fact table is included below.
Once those tables were developed in snowflake, I connected them to Tableau Desktop then built a data model in the Data Source pane in Tableau Desktop.
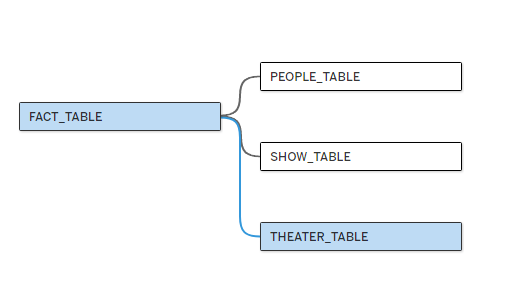
This was a fun opportunity to put some of the principles I have learned about data modelling and computing efficiency into practice, while building something that can be used by others in the future to build analyses!