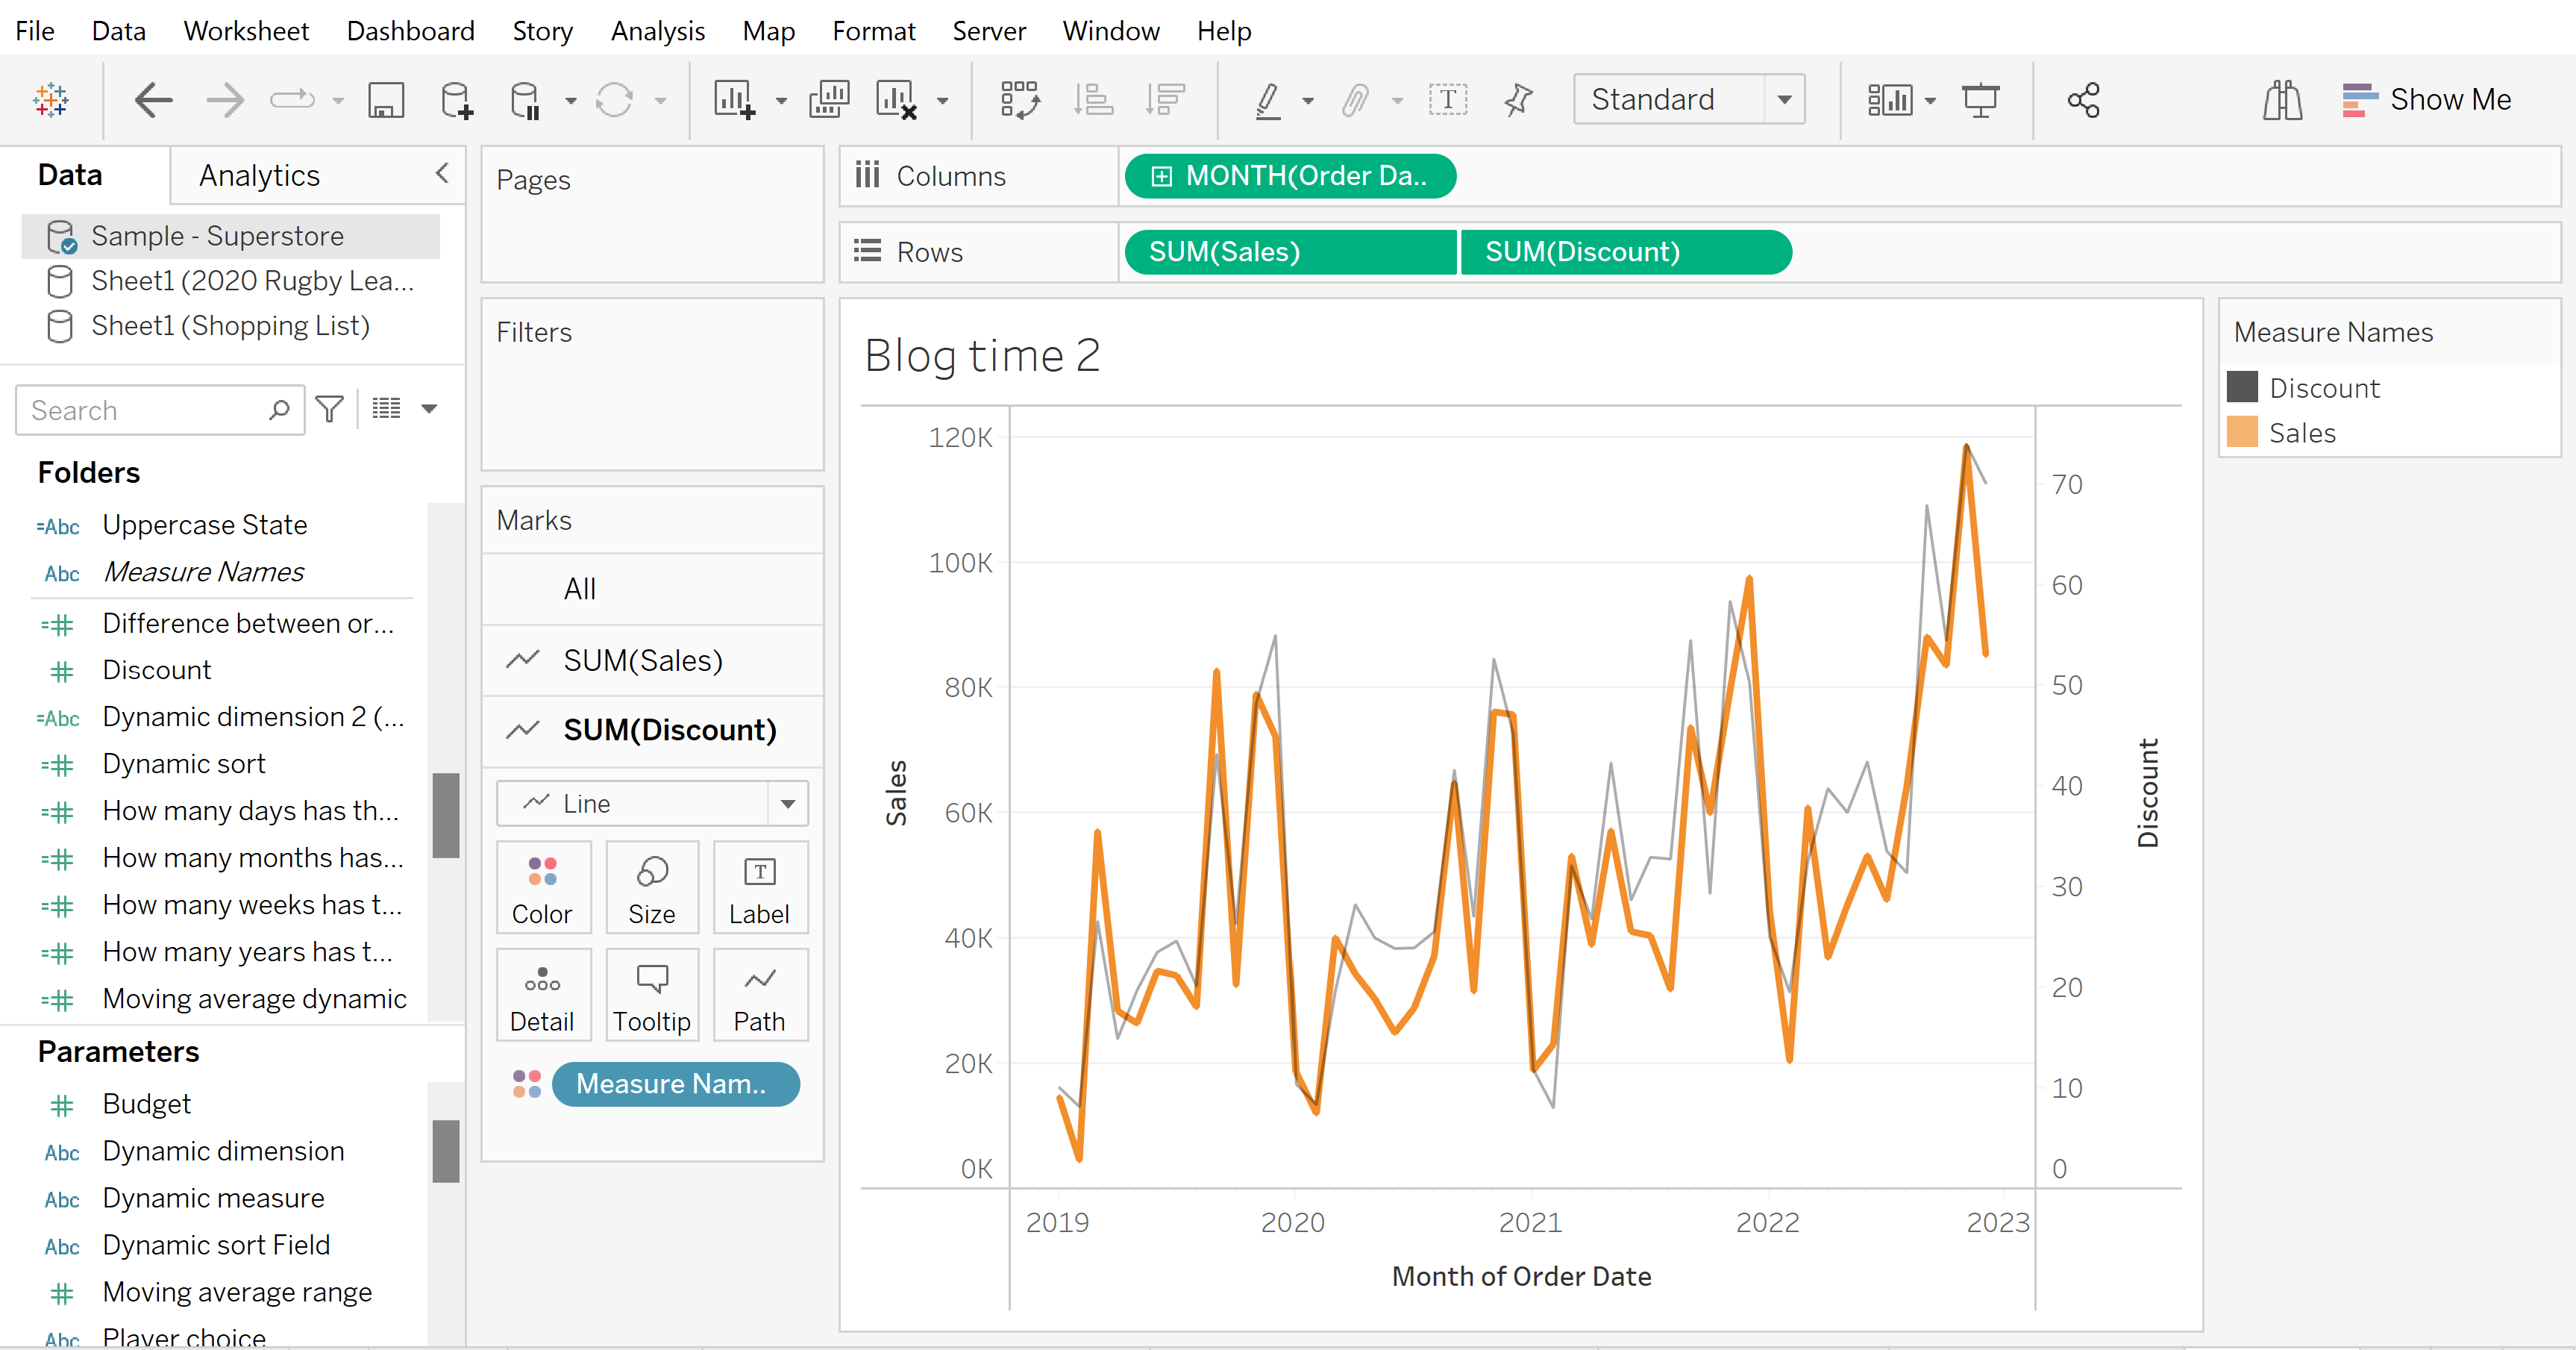
Early on in your Tableau journey, you may have mastered dragging fields into the columns and rows shelfs. As you find yourself facing a myriad of new charts, you may ask yourself, "How can I only show part of a field?". For this, we'll need a filter. Below, we have a chart from the superstore dataset, showing how sales and discounts are closely correlated across 4 years of data.

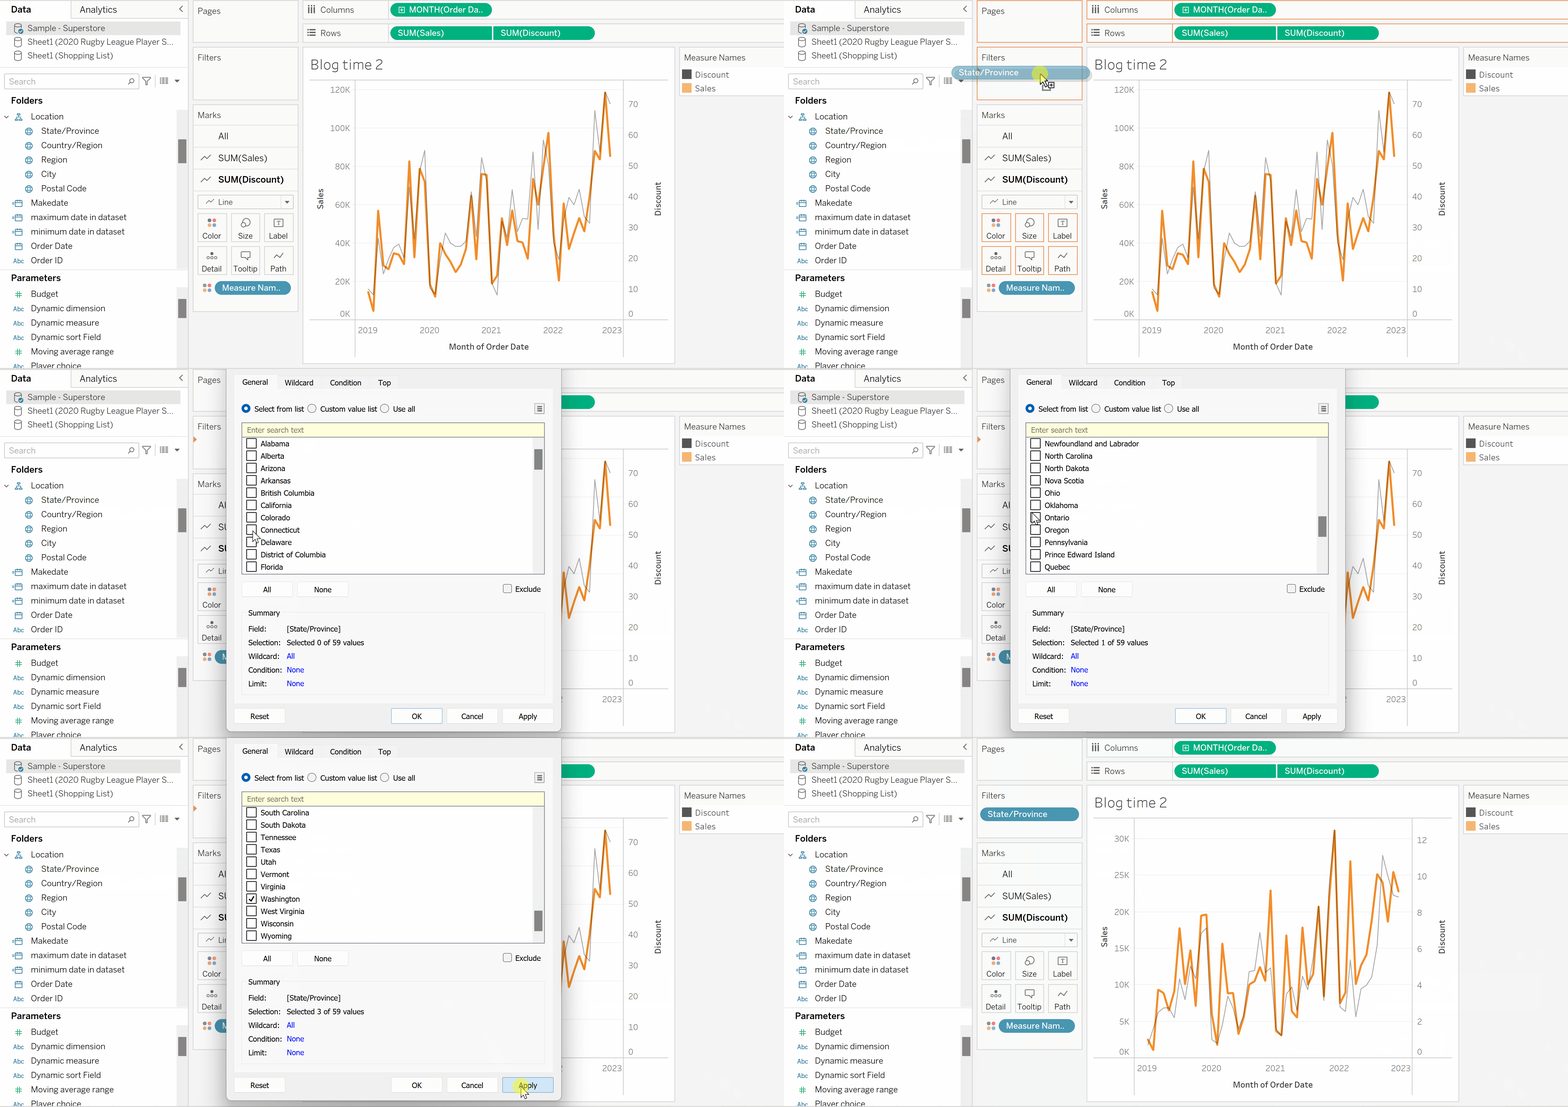
This is already really interesting, suggesting that discounts are a really powerful tool for boosting sales. We want to know more! We have lots of options to split the data by other fields, and filters are the tool. Below is a simple demonstration.

By simply dragging a field, in this case State/Region, we open up a filter menu listing all the states we have data for. In this example, we only care about US states on the Pacific Coast, so we select California, Oregon and Washington. Once we click apply, we can see the chart change in the background, and by clicking OK the filter is saved.
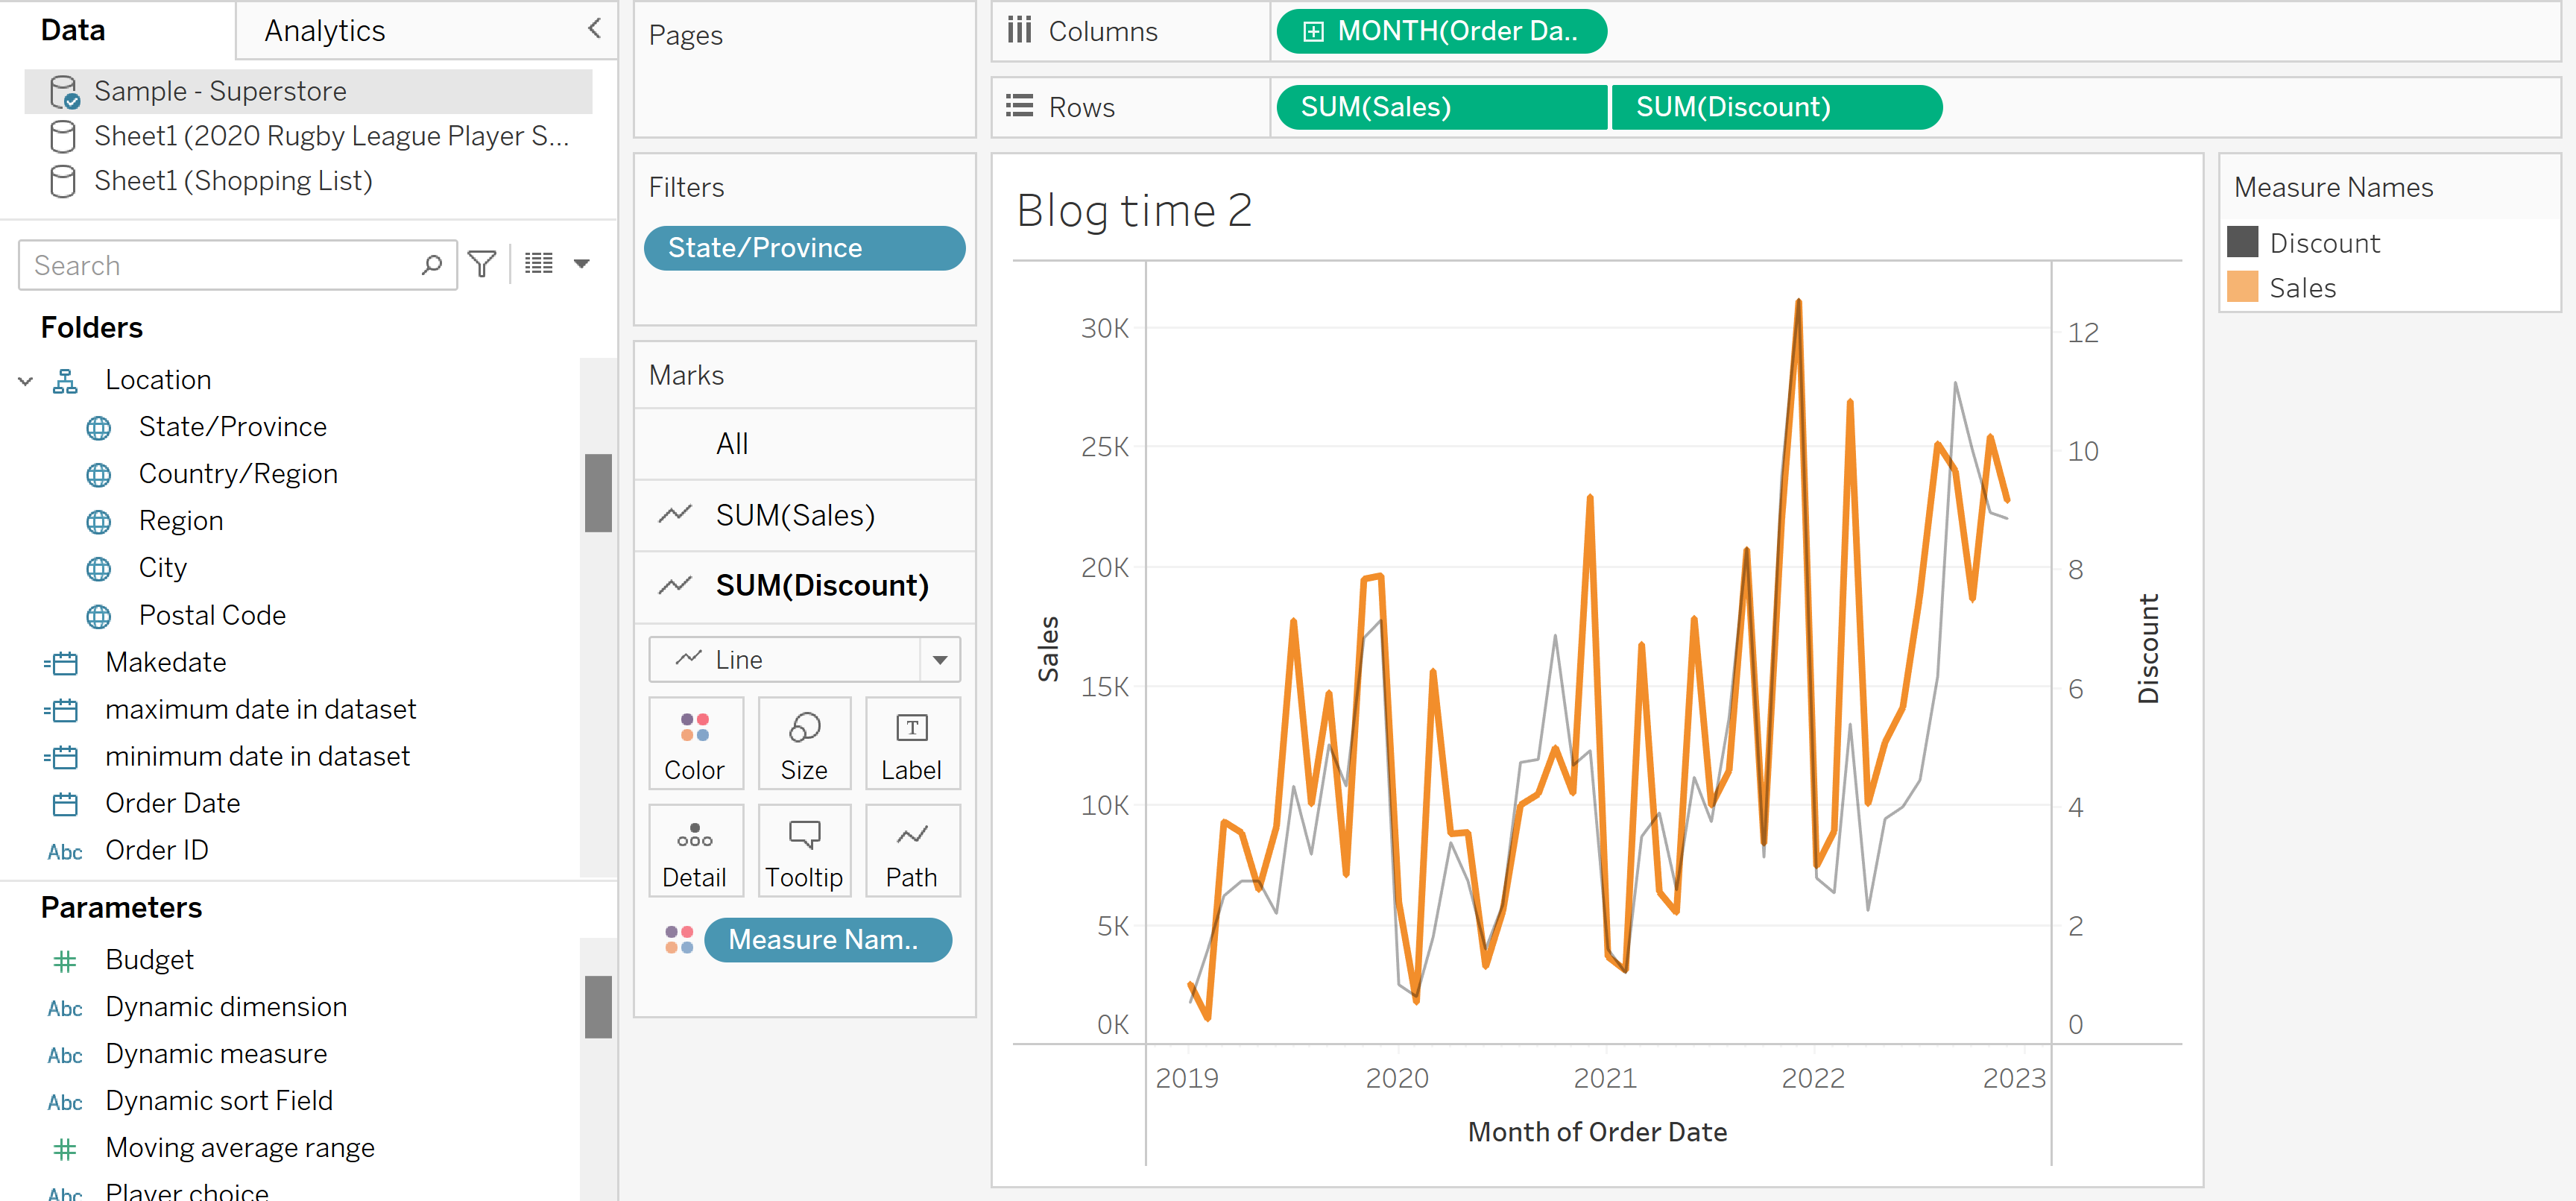
Congratulations! You've completed your first filter, and we can see that the discount-sales relationship still strong, although interestingly sales rise ahead of discounts in 2022.

In this case, we've filtered by a blue field, which is known as a dimension. This is typically discrete data, such as States. This is very different from the green fields, which represent continuous data. Read more on the difference between blue and green fields here.
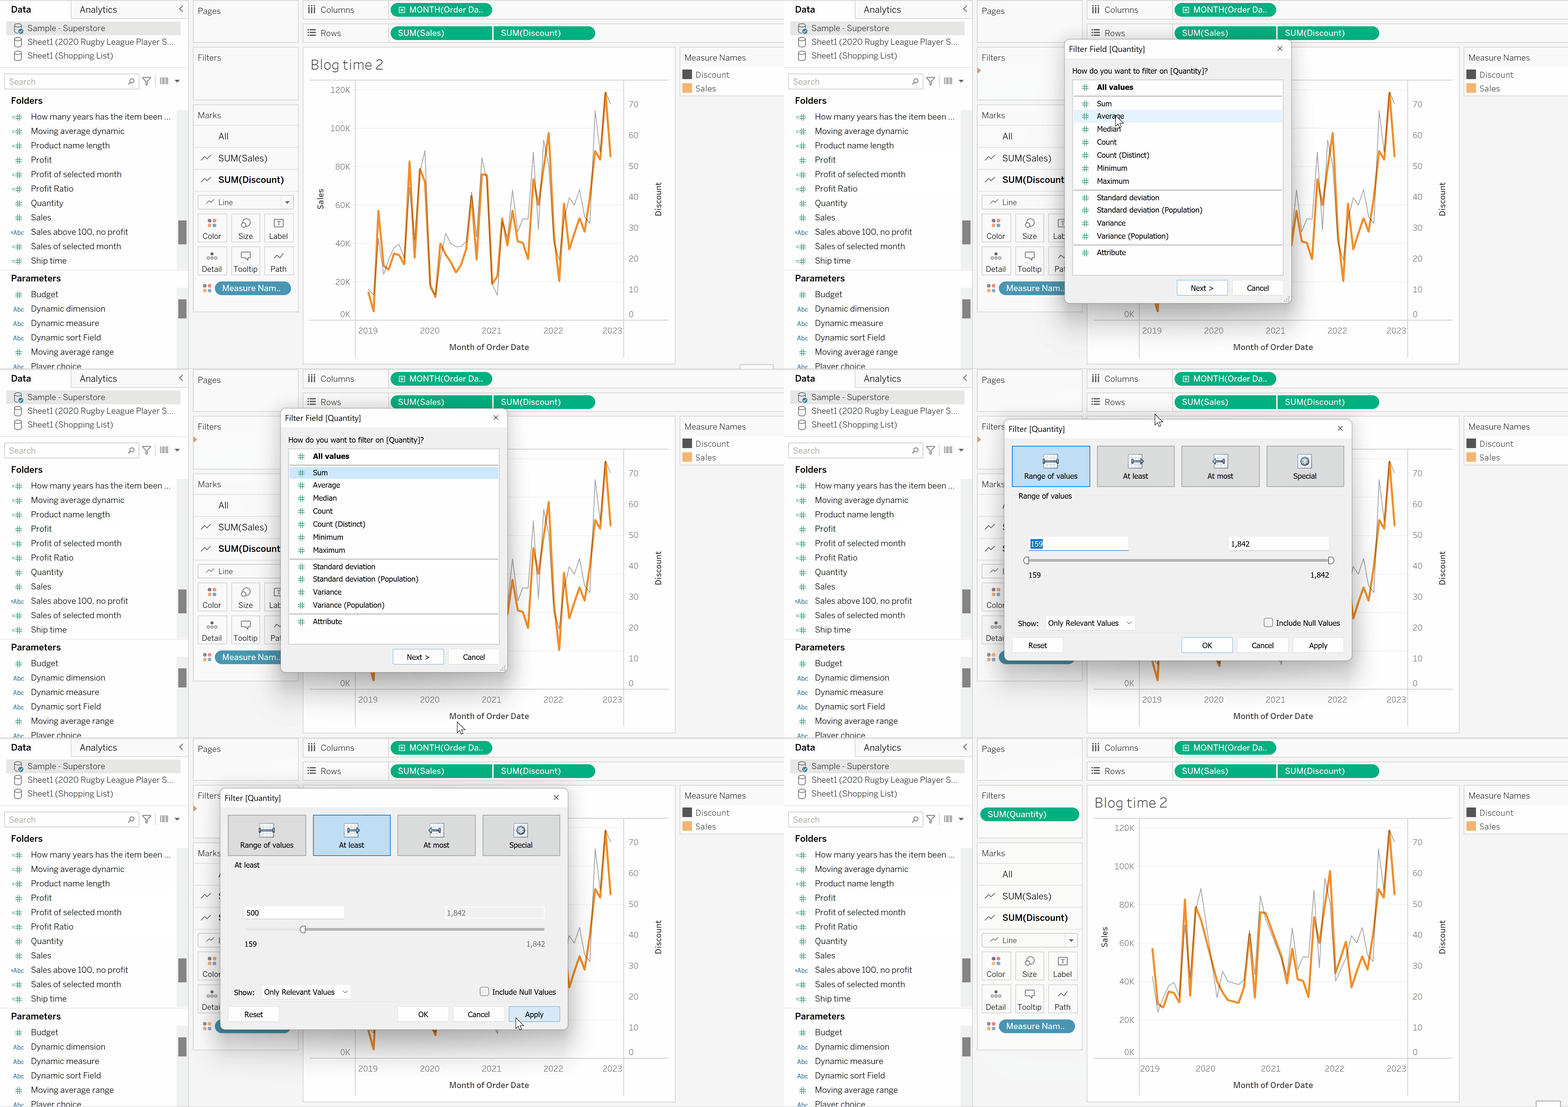
How would filtering for a green/continuous field look?

Once again, we simply drag the field into the filters card, but we're presented with an entirely different window. We first decide if we want to aggregate our field, and by what mathematical method. This is really useful when looking at time series data, as you can match the time interval of your filter to the chart.
Rather than selecting individual values to display, we are asked to select a range of values, or apply a rule to limit datapoints above or below a specific value. This allows us to simply examine a subset of a measure without selecting specific values to include.
