


Week 2 was mostly Tableau, and the thing that held me up longest was Level of Detail expressions. Not the syntax. The syntax is short. What tripped me up was INCLUDE, and one specific question: if I want the average sales per customer shown by region, why does the formula not mention region at all?
If you’ve struggled at the same thing, this is the explanation I wish I’d had. I’ll use Sample Superstore so you can follow along.
What an LOD actually does
A normal Tableau calculation runs at the level of whatever dimensions are in your view. Put Region on Rows and Tableau groups everything by region. Simple.
An LOD lets one number ignore that and compute at a level you choose instead. That’s the whole point. The chart is grouped one way; you want a number grouped another way. The syntax is just:
{ FIXED [dimension] : aggregation }
Read it as: “for each of this dimension, give me this number, regardless of what the chart is doing.”
FIXED and EXCLUDE made sense to me quickly. FIXED pins the number to the dimensions you name and ignores the view. EXCLUDE takes the view’s dimensions and drops one. INCLUDE was the one I kept re-reading.
Why the grouping field isn’t in the INCLUDE formula
Here’s the example that fixed it. In Superstore I wanted the average sales per customer, then shown by region. The formula is:
{ INCLUDE [Customer Name] : SUM([Sales]) }
No Region anywhere. That’s what threw me. I expected the field I was grouping by to appear in the calculation. It doesn’t, because INCLUDE works in two steps, and Region belongs to the second step, not the first.
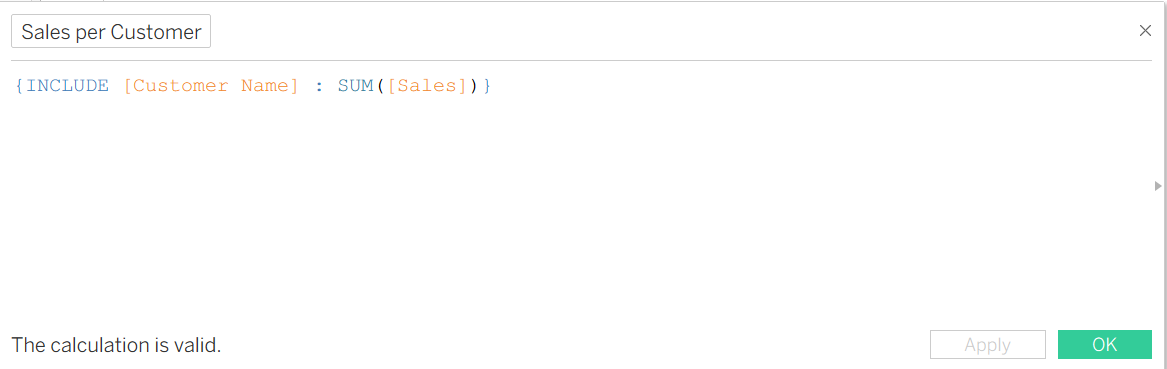
Step one: Tableau computes the expression at the level you named plus whatever is in the view. Here that means per Customer Name. So it works out the total sales for each individual customer. This is the fine-grained number.
Step two: the view takes over. Region is on Rows, so Tableau buckets those per-customer totals into the four regions and aggregates them, usually with AVG.
So Region never sits inside the formula. It does its job afterwards, in the view. INCLUDE only says “go one level finer than the chart for this calculation.” The chart’s own dimension handles the grouping on the way back up.
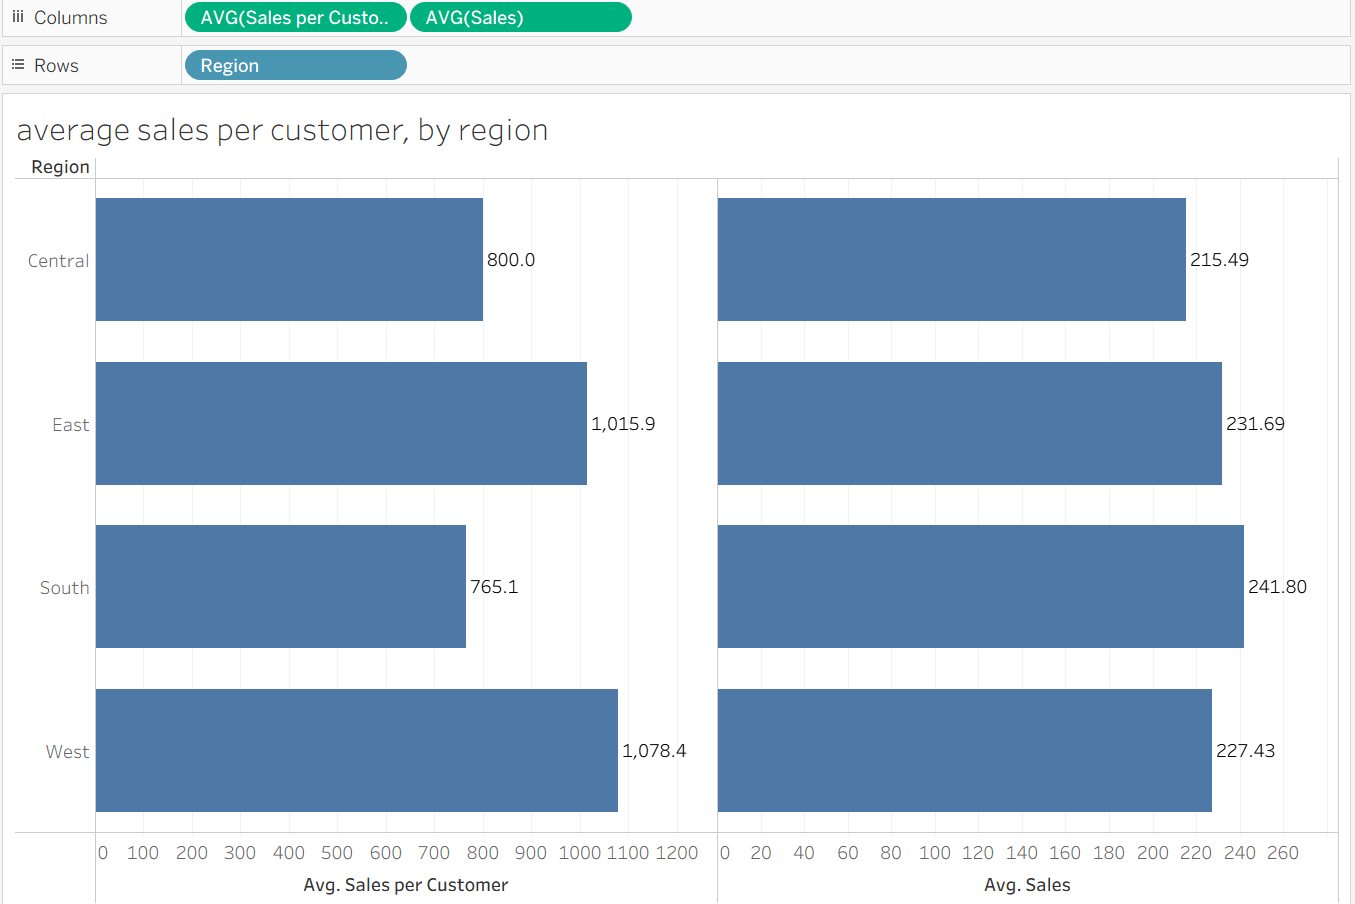
This is where INCLUDE earns its place. Superstore has one row per order line, so a plain AVG([Sales]) averages line items, not customers. INCLUDE rolls the sales up to each customer first, so you get what you actually meant: the average customer’s spend. Put the two side by side and the numbers differ, that gap is the whole point.
Once I saw it as two steps rather than one, it stopped being strange. The formula sets the fine level. The view sets the coarse one. INCLUDE is the bridge.
When to reach for each
FIXED: a fixed baseline that shouldn’t move. Total sales per customer. First order date per customer.
INCLUDE: a fine-grained number you want to show at a coarser level. Average sales per customer, shown per region.
EXCLUDE: a subtotal or overall figure while you’re showing detail. A region total sitting next to each city.
One more thing worth knowing early. FIXED ignores your dimension filters unless you add them to context; INCLUDE and EXCLUDE respect them. If a FIXED number seems to ignore a filter, that’s expected, and “Add to Context” on the filter sorts it.
What I’d tell myself a week ago
Stop reading the formula left to right as one action. An INCLUDE or EXCLUDE calculation is a combination between the level you name and the level the chart is already at. Name the fine level in the braces. Let the view do the grouping. That single reframe turned LODs from something I copied off a cheat sheet into something I can reason about.