


What is scaffolding?
Scaffolding means building the rows your data should have, so you can analyse the rows it doesn't have.
Most datasets only record when something happens. An orders table has a row for each order, not for each day. A booking table has a check-in date and a check-out date, not a row for each night. If you chart this as it stands, the quiet days vanish and your trend lines skip over them.
A scaffold fixes that. You create a complete frame of values, usually dates and attach your real data to it. The gaps become visible rows with zero or null values. This week I used Tableau Prep to do it, and this post walks through how.
When you need it
Scaffolding solves two common problems:
- Missing dates. You have sales by day, but some days had no sales. Without those rows, a moving average or running total is wrong.
- Start and end ranges. You have a subscription, contract or booking with a start and end date. You need one row per day or month it was active.
Tableau Desktop can patch some of this with Show Missing Values, but the fix only lives in that one view. Doing it in Prep puts the scaffolded rows into the dataset itself, so every workbook built on it gets them.
Worked example: hotel bookings
The question: how many rooms were occupied each night in March?
I used a made-up sample of 12 bookings, one row per booking. The first three look like this:
Step 1: Fix the date types
Add a Clean step after the input. Check that Check-in and Check-out are Date fields, not strings. New Rows will not let you pick a string field.
Step 2: Work out the last night
A guest who checks out on the 6th does not stay the night of the 6th. Create a calculated field:
[Last Night] = DATEADD('day', -1, [Check-out])
Skip this and every booking gains a night it never had
Step 3: Add a New Rows step
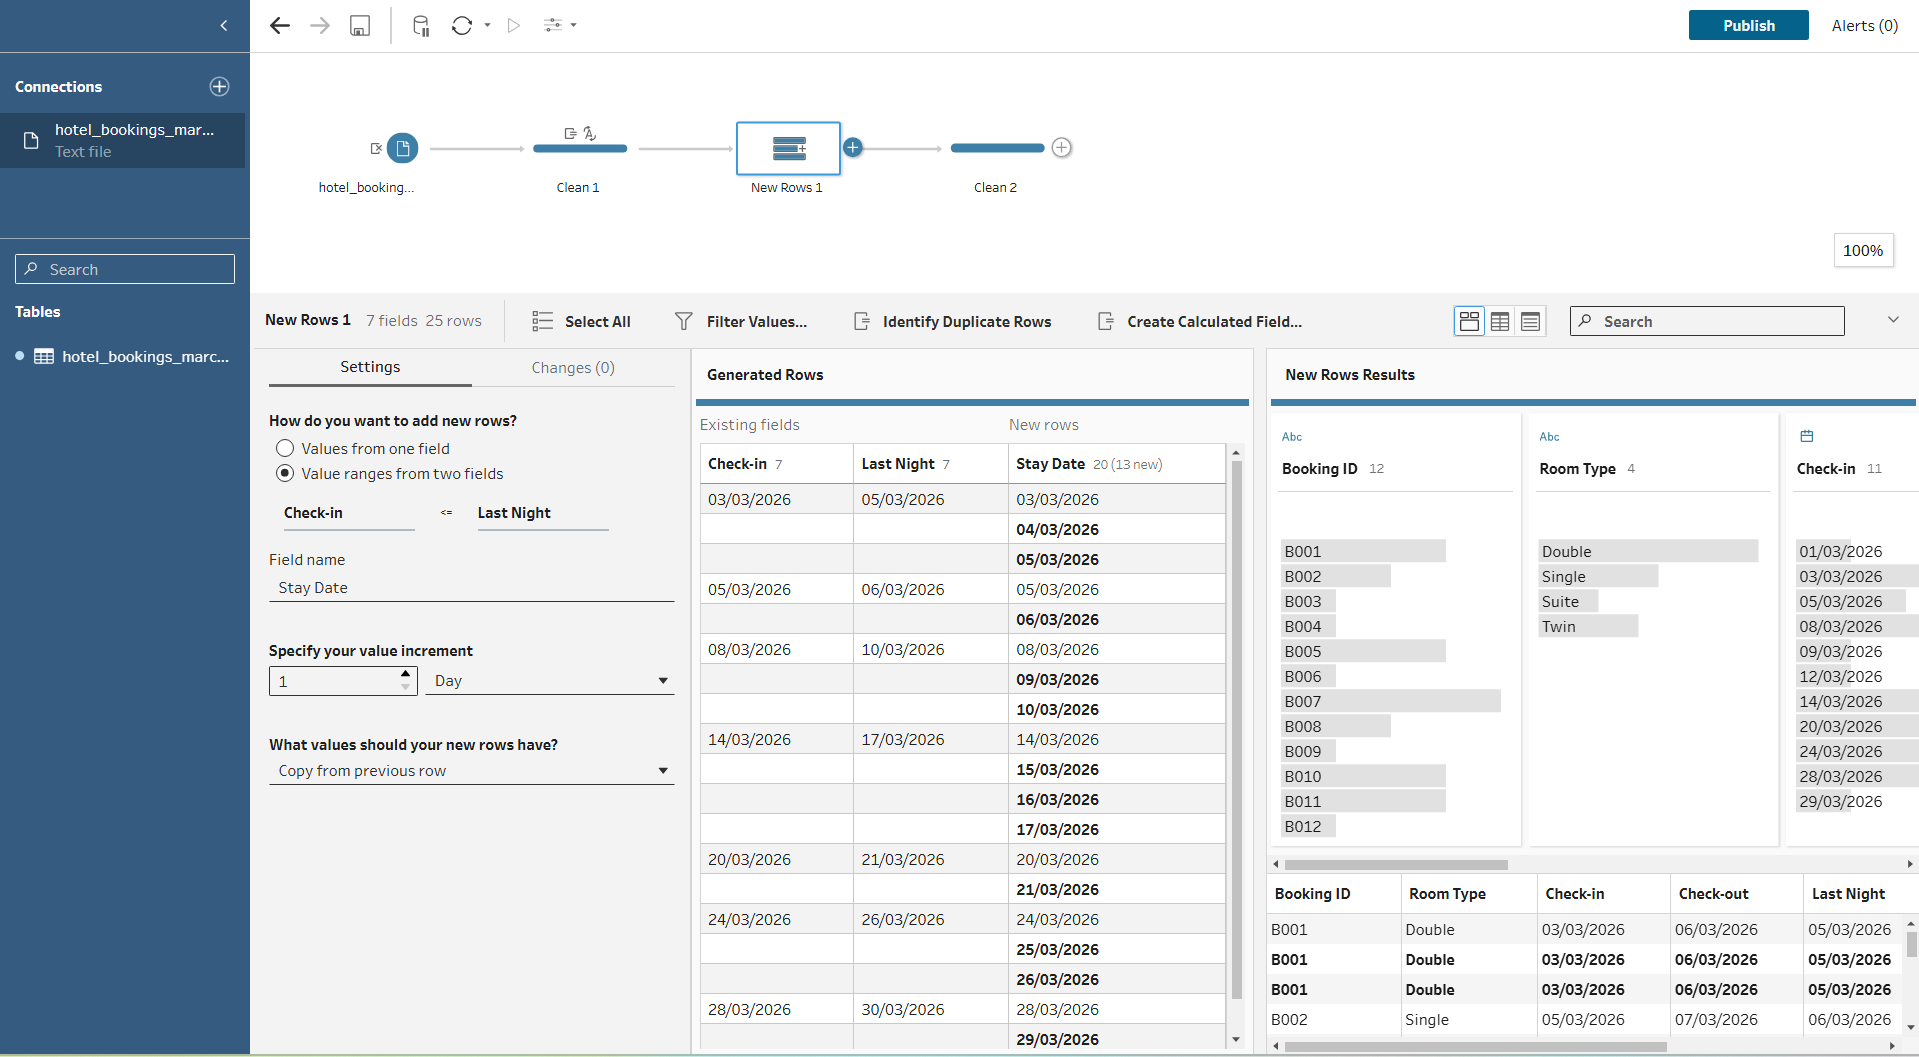
Click the + on the Clean step and choose New Rows. Set it up like this:
- Create new rows using: Value range from two fields
- Start: Check-in. End: Last Night
- Increment: 1 day
- Name the new field Stay Date
- Fill new rows with: Copy from previous row
Copying keeps Booking ID and Room type on every new row. B001 now has three rows: 3, 4 and 5 March
Step 4: Check the row count
The 12 bookings should now be 25 rows, one per booked night. Check the count in the profile pane before you move on. If it doesn't match, the date logic is off.

Step 5: Fill the empty nights
The data now has a row for every booked night, but nights with no bookings still don't exist. To show them as zero, roll the data up to one row per night, then let New Rows fill the gaps:
- Add an Aggregate step after New Rows. Group by Stay Date only.
- Add Booking ID as an aggregated field, set it to Count Distinct and rename it Rooms Occupied. This gives 21 rows, one per night with at least one booking.
- Add a second New Rows step. Choose Values from one field, pick Stay Date and set the increment to 1 day.
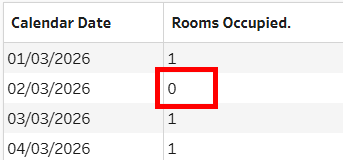
- Set the new rows to Null or zero. Number fields get 0, so the empty nights show 0 rooms without a ZN() calculation.
New Rows adds the 9 missing nights, giving 30 rows: one per night from 1 to 30 March. It only fills between the first and last date in your data. If you need dates beyond that, such as 31 March, join to a calendar table instead

Mistakes I made (so you don't)
- Copying measures. Copy from previous row duplicates every field. If the table held total booking value instead of a nightly rate, summing it would count the revenue once per night. Copy IDs and categories; recalculate or null the measures.
- Ranges across the whole dataset. When you use a single field, New Rows fills between the overall min and max, not per group. To get a range per hotel or per state, aggregate to one row per group with its own min and max first.
- Too many fields going in. Extra rows before New Rows mean extra rows after it. Aggregate down to the fields you need, then join the detail back.
- Not checking row counts. Note the count before and after each scaffold step. It is the fastest way to catch an off-by-one error.
Takeaways
- Scaffolding gives you rows for what didn't happen, so your trends and averages are honest.
- In Tableau Prep, New Rows handles most cases in one step: fill missing values in one field, or expand a start and end date.
- Think about the boundaries (is the end date included?) and what gets copied.
- Check your row count every time.