This blog post will go through how you can create a continuous path using multiple data points in Alteryx and how you can export this to Tableau.
In this example we are using 'All Storms' data to create a storm path.
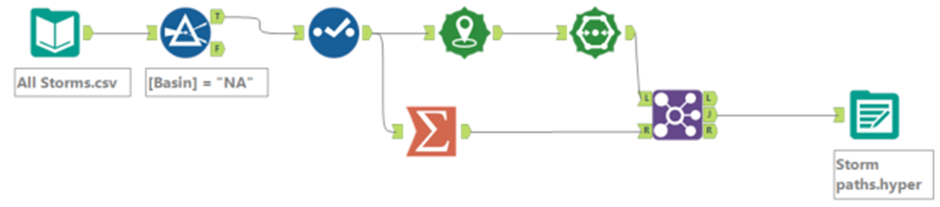
Step 1: Connect to csv data file using Input File tool
Step 2: Use Filter tool to filter the Basin field to 'NA' (North Atlantic) as we want to focus our analysis in this area only
Step 3: Use Select tool to change DateTime field to DateTime data type
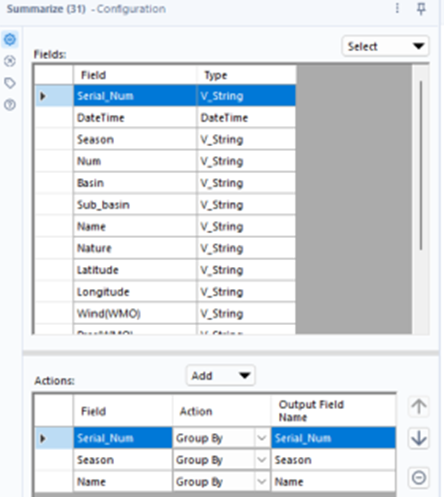
Step 4: Use Summarize tool to group by Serial Number, Season and Name as we want to combine this data to create a single storm path for each Serial Number, Season and given Name.
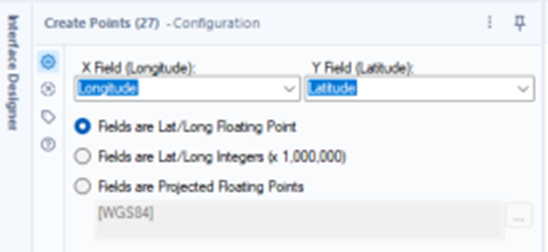
Step 5: Use the Create Points tool to create spatial object points for each row of data (in this case storms each have a serial number which has multiple points associated with it) by selecting the longitude and latitude fields.
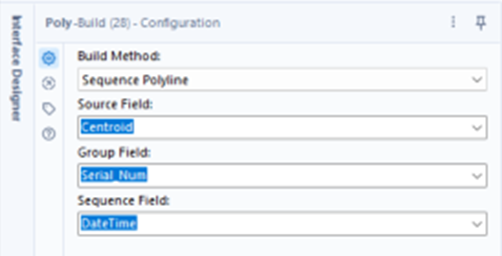
Step 6: To create lines symbolising the storm paths, we join the points using the Poly-Build tool. We select the Centroid field that contains the points as the source field, grouping by the Serial Number field and sequencing by the DateTime field.
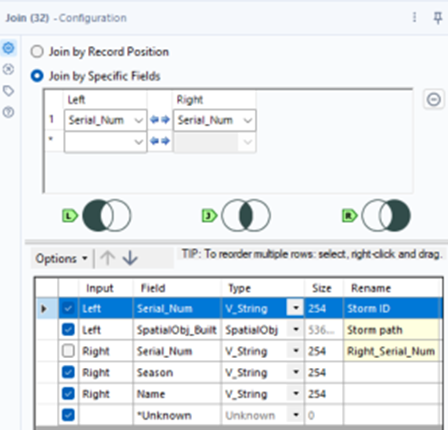
Step 7: Use a Join tool to combine the output of the Poly-Build tool and Summarize tool by selecting 'Join by Specific Fields' and 'Serial Number' from the Left and Right drop-down. Rename the 'Serial_Num' field to 'Storm ID' and SpatialObj_Build' field to 'Storm Path'.
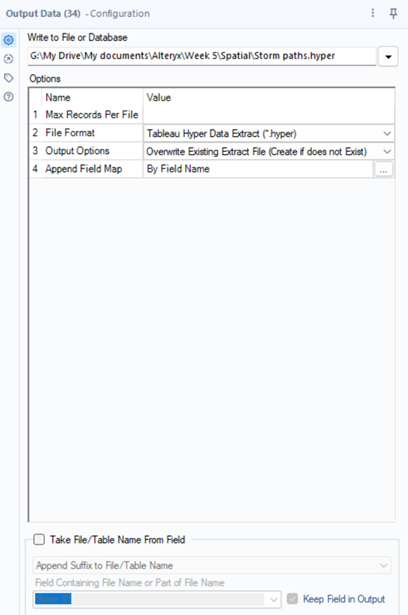
Step 8: Before we can import the data into Tableau, we need to use the Output Data tool to export the data as a 'Tableau Hyper Data Extract'.
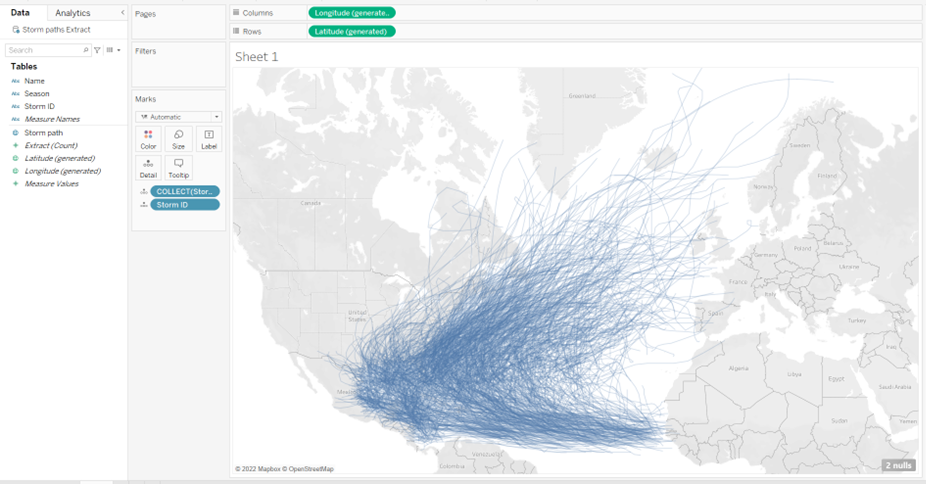
Step 9: We can now import the data into Tableau. We can build our map by double-clicking both latitude and longitude, then adding the Storm Path and Storm ID to detail.