Step 1: Adding a Trend Line
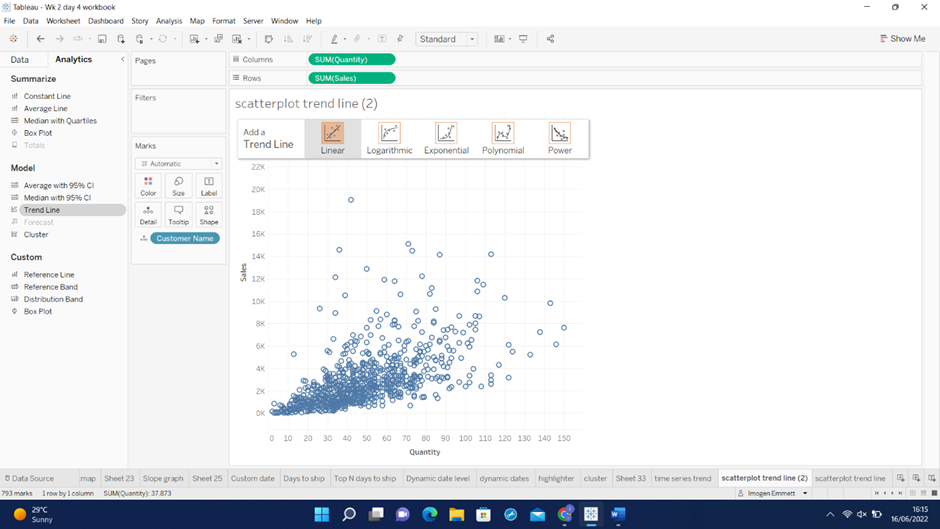
Click on the Analytics pane > single click and drag the trend line on to the scatterplot until you see the Add a Trend Line window appear > drop on which type of trend line you think is most appropriate for the data you're using.
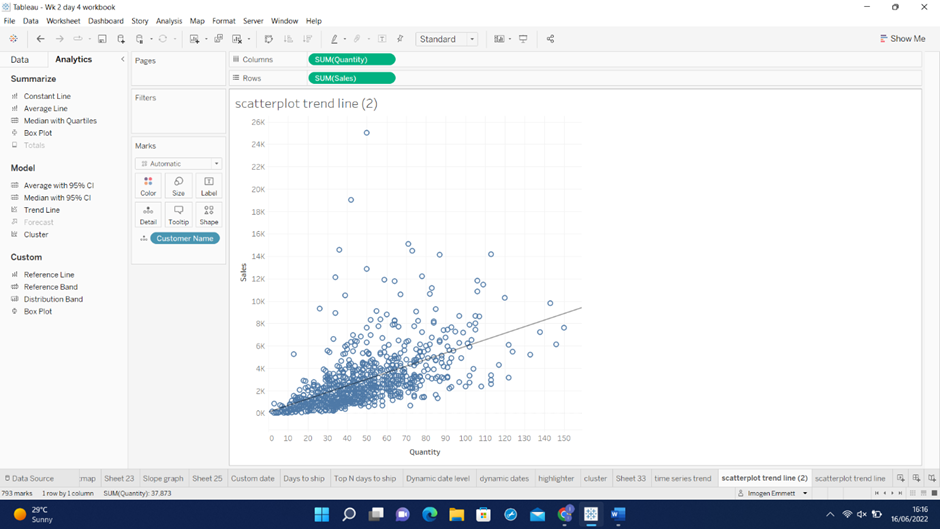
In this case, selecting Linear will add a trend line as follows:
Step 2: Editing and Formatting the Trend Line
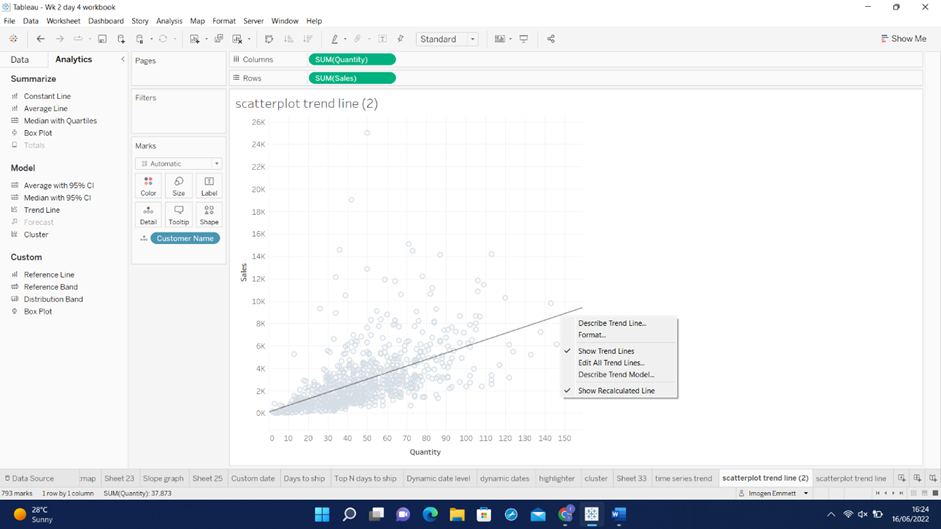
Right click on the trend line and the following window opens giving you multiple options to edit and format the trend line.
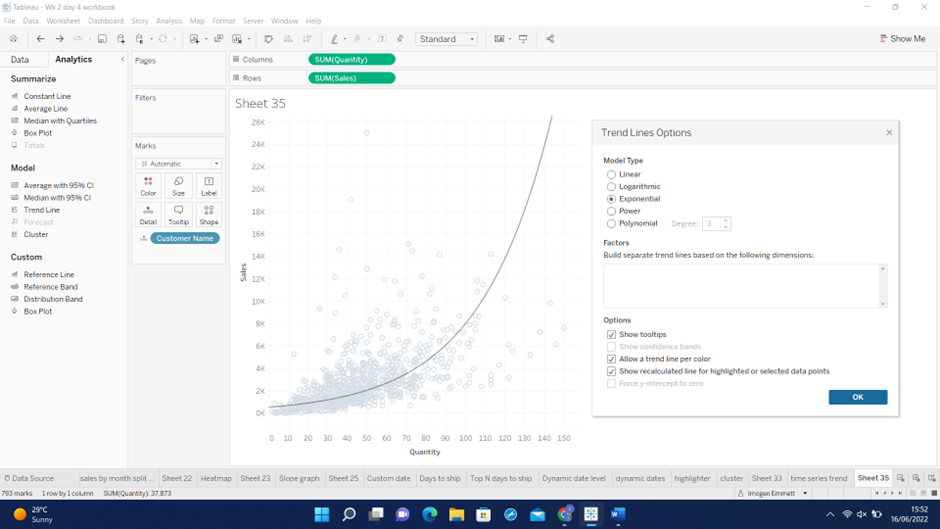
In this case, the linear trend line doesn't appear (by eye) to be the most appropriate type of trend line for the data we're using; in this case, an exponential trend line may fit the data better. To change the type of trend line to exponential right click the trend line > Edit All Trend Lines > select appropriate Model Type. You can also edit the line using the options in the window.