


The task
- Download 2 datasets on github: bands csv and boys csv
- If data prep is required, use either Alteryx or Tableau Prep
- Add additional data if you want to
- Can use any data visualisation tool of our choice
- Write a blog
My Plan
- Read the documentation about the 2 datasets on github
- View the data in Alteryx and carry out any data prep that needs doing
- Sketch dashboard on Excalidraw
- Create dashboard in Tableau
- Write blog
Data Prep - Alteryx
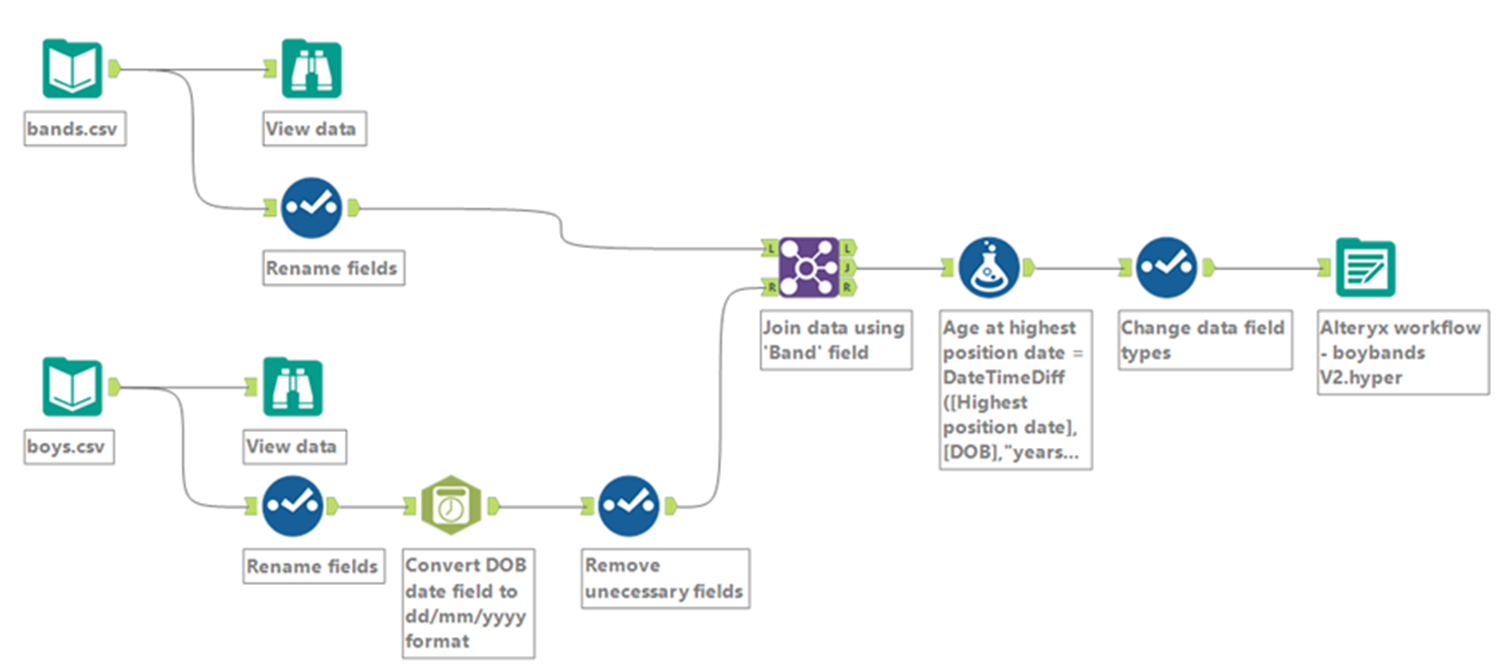
Step 1: added an input tool for the 'Bands' and 'Boys' dataset
Step 2: added a select tool to rename some of the data fields
Step 3: used a DateTime tool to convert the Date of Birth field to a dd/mm/yyyy format
Step 4: join both datasets together using the 'Band' field
Step 5: added another Select tool to change some of the data field types
Step 6: Outputted the workflow as a Tableau Hyper file
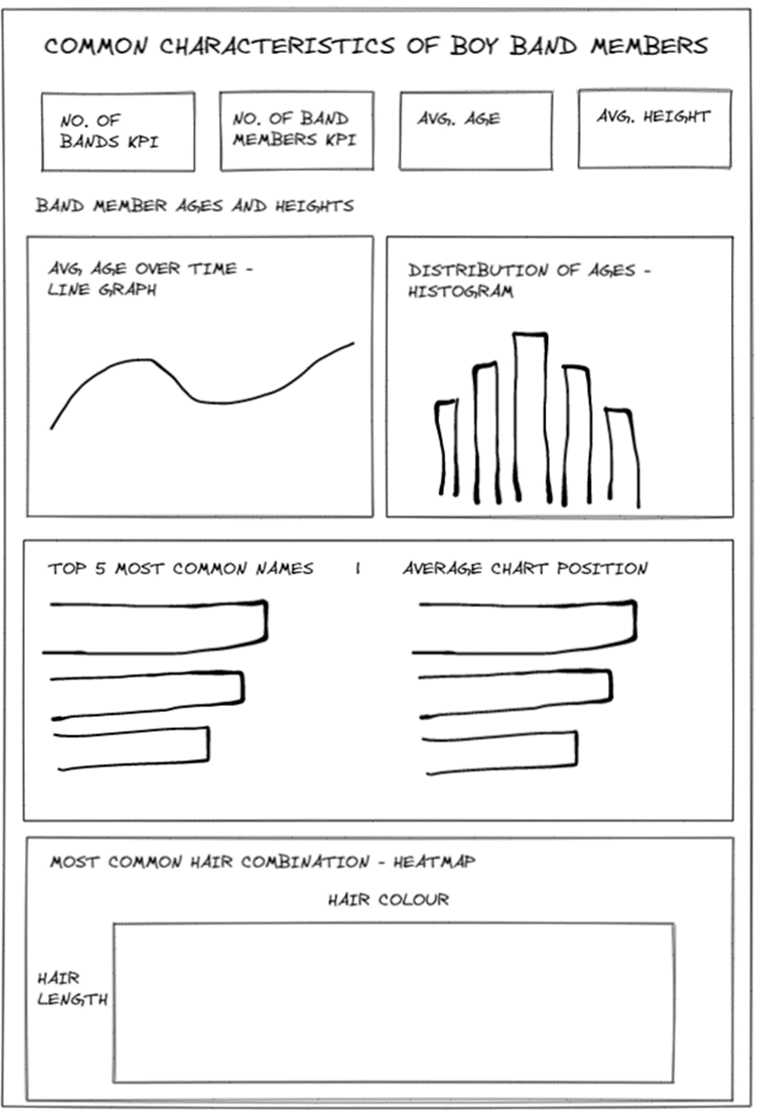
Excalidraw
I decided to create a dashboard looking at the common characteristics of boy band members. I chose to have 3 main sections to my dashboard - one looking at band members' ages and heights, one looking at common names and the other looking at common hair combinations (hair length and hair colour).
Final Dashboard
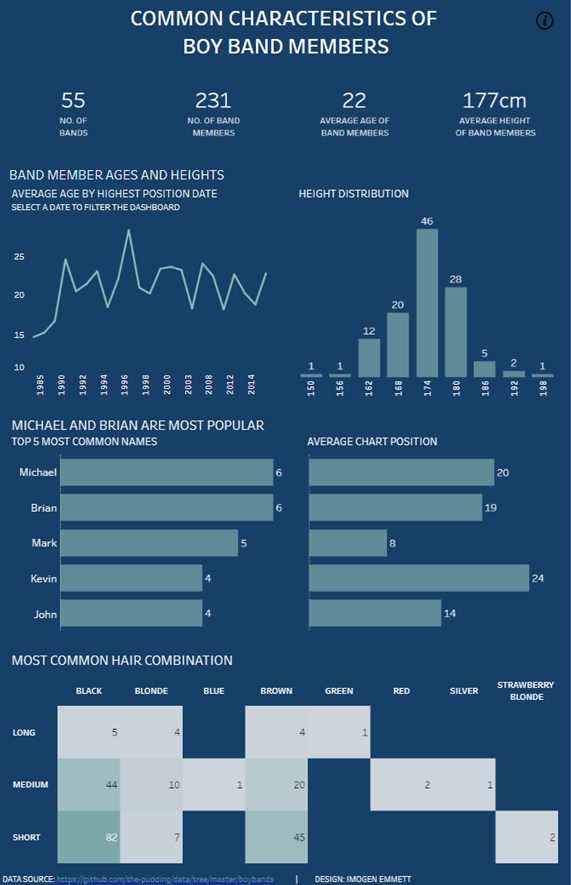
Link to dashboard: https://public.tableau.com/app/profile/imogen8656/viz/Boybandsdashboard/Dashboard1