


This week is the final week of training for DS32, and that only means one thing...dashboard week.
Today's project required us to:
- Use data from the UK street crimes API in Alteryx
- Build an Alteryx App that allow users to pick a date range and crime category as well as enter a postcode
- The App must then render a Tableau KPI dashboard automatically
The Workflow
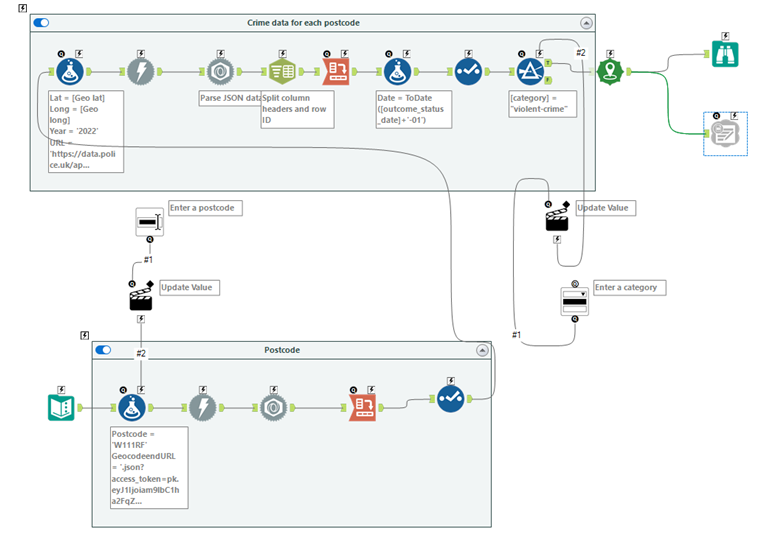
I had to use data from the UK street crimes API and a MapBox API to obtain UK postcodes.
I entered the URL for the MapBox API and connected the download tool to retrieve UK postcodes. I then used the JSON Parse tool to parse out the values into a table from the DownloadData field. The Cross-Tab tool split the rows into columns, and the Select Tool allowed me to select the fields required.
I then added this to the API for UK street crime data by connecting the Select Tool and Formula Tool. The Formula Tool created each of the variable parts with their values as strings using the UK crime data - I added a field called ‘query’ which reconstructed the URL as a string. I then connected to a Download Tool using ‘query’ in the URL field box.
Again, I used the JSON Parse tool to parse out the values into a table from the DownloadData field. I then used the Text-to-Columns tool to split the numbers and headers I'd be using for my fields. The Cross-Tab tool split the rows into columns. To create the App, I added a couple of filters - one to allow the user to select a crime category, and the other for the postcode.
I added a Create Points tool to map out the latitude and longitude data - I then used a Browse Tool to check that the points mapped as expected. The last step was to output to Tableau as a Google Sheet.
The Dashboard
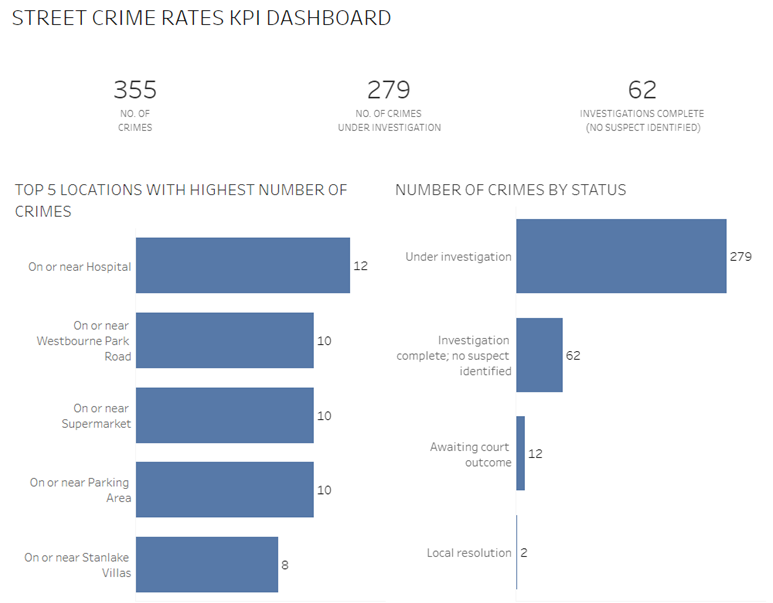
Once the App had been set up and outputted as a Google Sheet it was time to create a Tableau KPI dashboard - this is my version. Unfortunately, I ran out of time to set up the App so that it renders a Tableau KPI dashboard automatically.