


For days 2&3 of dashboard week, we were tasked with designing a dashboard for the Data+ Movies Challenge for Tableau. We received two days to complete this dashboard so the stakes were definitely high!
The main requirements were to narrow our focus for our datasets, carry out any data preparation and many of us wanted to include additional data to provide further insights to our data.
As a lover of the 1920s to 1960s era I chose to concentrate on actresses within these decades. I started by designing a plan focusing on the films careers of four iconic actresses: Audrey Hepburn, Judy Garland, Marilyn Monroe and Vivien Leigh and created a plan of what I wanted my dashboard to look like.
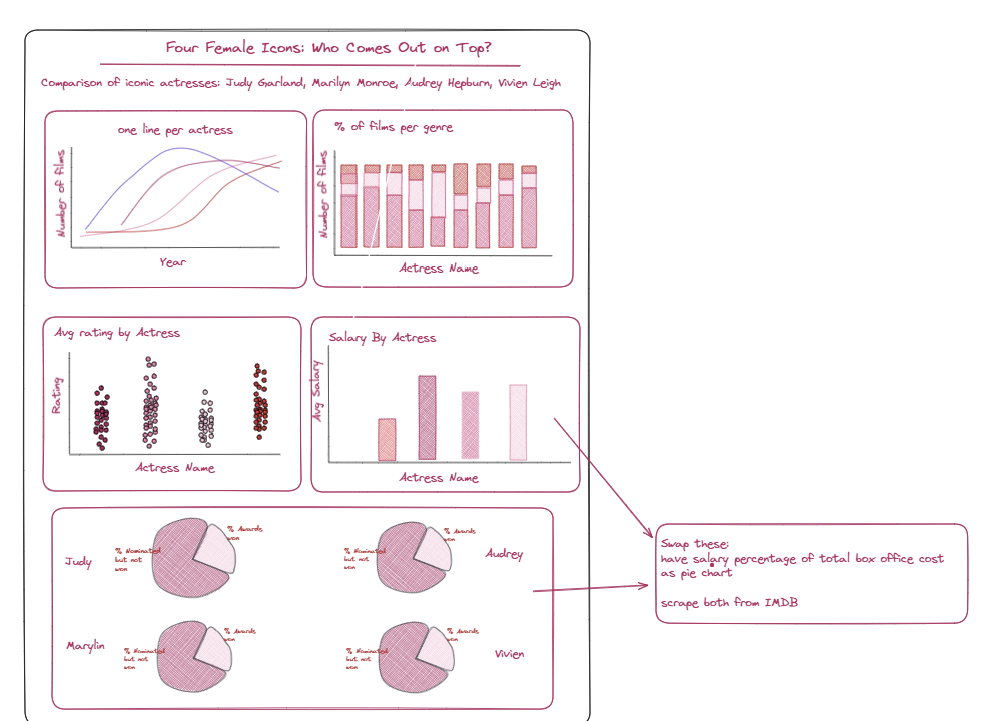
My original plan involved comparing the number of films by actress over time and genre and then examining the ratings of these films, awards nominated for and won for the said actresses and incorporating data for salaries vs box office. My idea was to webscrap the salary and box office data from IMDB and joining this to the original data set.
After a chat with Jenny, I decided to swap the charts for salary and awards to provide better insights.
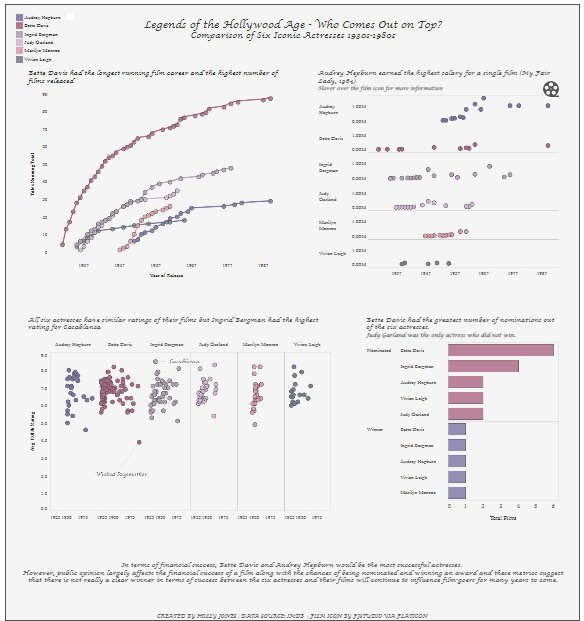
The original dataset required minimal preparation but after filtering it to the four actresses I required, I only had 73 rows so decided to add in two more icons: Bette Davis and Ingrid Bergman.
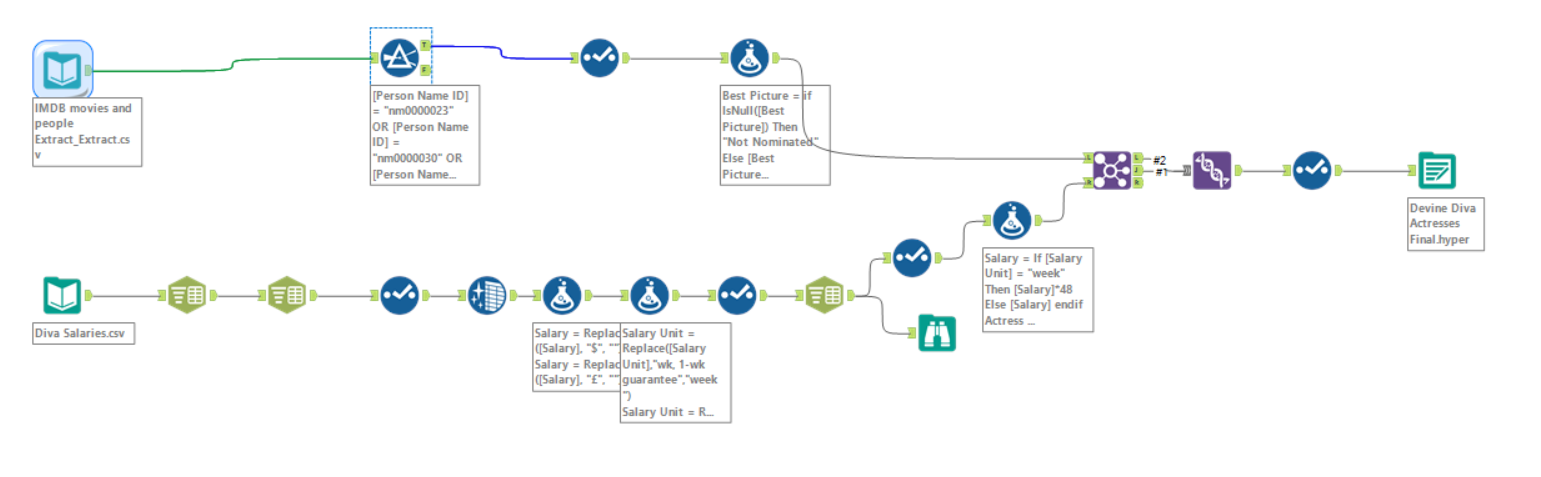
The main issues I had was obtaining the additional datasets for salary and box office data. IMDB has a box for each actress containing salaries for some of the films that appeared in. However, despite my extensive attempts to use RegEx in Alteryx to achieve the required salary, film name and release year (including Jenny's help), the webscrapping just didn't want to work. I, therefore, copied the data from each table into an google sheet and prepped the data in Alteryx (which required a lot more prep, including splitting a rows to columns, replacing data using formulas and aggregation of salaries which were only given as a weekly salary rather than a total for the whole production).
Obtaining the box office was where I really struggled as I would have had to webscrap at least 70 different IMDb pages, and after my previous failure at webscrapping, I didn't want to waste time trying again. After searching the web for the data I needed and, even starting a trial subscription for IMDBPro which claimed to show box office data but negated to mention that you can't export it, I had to admit defeat and forgo the box office data.
The final dashboard is shown below. I made slight changes to the original plan by by removing the genre stacked bar chart as there were too many categories to provide real, clear insights. I also changed the bar chart showing salary per actress to a scatter chart depicting the salaries over time and then adding a tooltip outlining the films which made up the total years salary. This would help highlight the changes over time for salaries as the increases can also be due to currency inflation over time which I wanted to demonstrate.
Further considerations I would make are:
- Research more into webscrapping specifically for IMDb using APIs - there were a few articles on how to do this on the internet but APIs aren't really my expertise so I would need a bit more time to explore this and get the hang of it.
- Include actors aswell - compare salaries between and within genders
- Further deep dive into genres using parameters to examine if there were differences in salaries, rating etc by genre or if one actress worked more in certain genres.
Overall this was a thoroughly enjoyable challenge and gave me chance to explore an area that I found really interesting.