


The LAST() function in Tableau is a useful table calculation function that allows you to access the value of a specific field from the last row within a partition defined by partitioning fields in your visualization. This function is particularly useful for performing year-on-year and other calculations or comparisons over time frames.
Here, we are going to explore how to create the above year-on-year sales chart using the LAST() function, highlighting the last two years of sales in different colours.
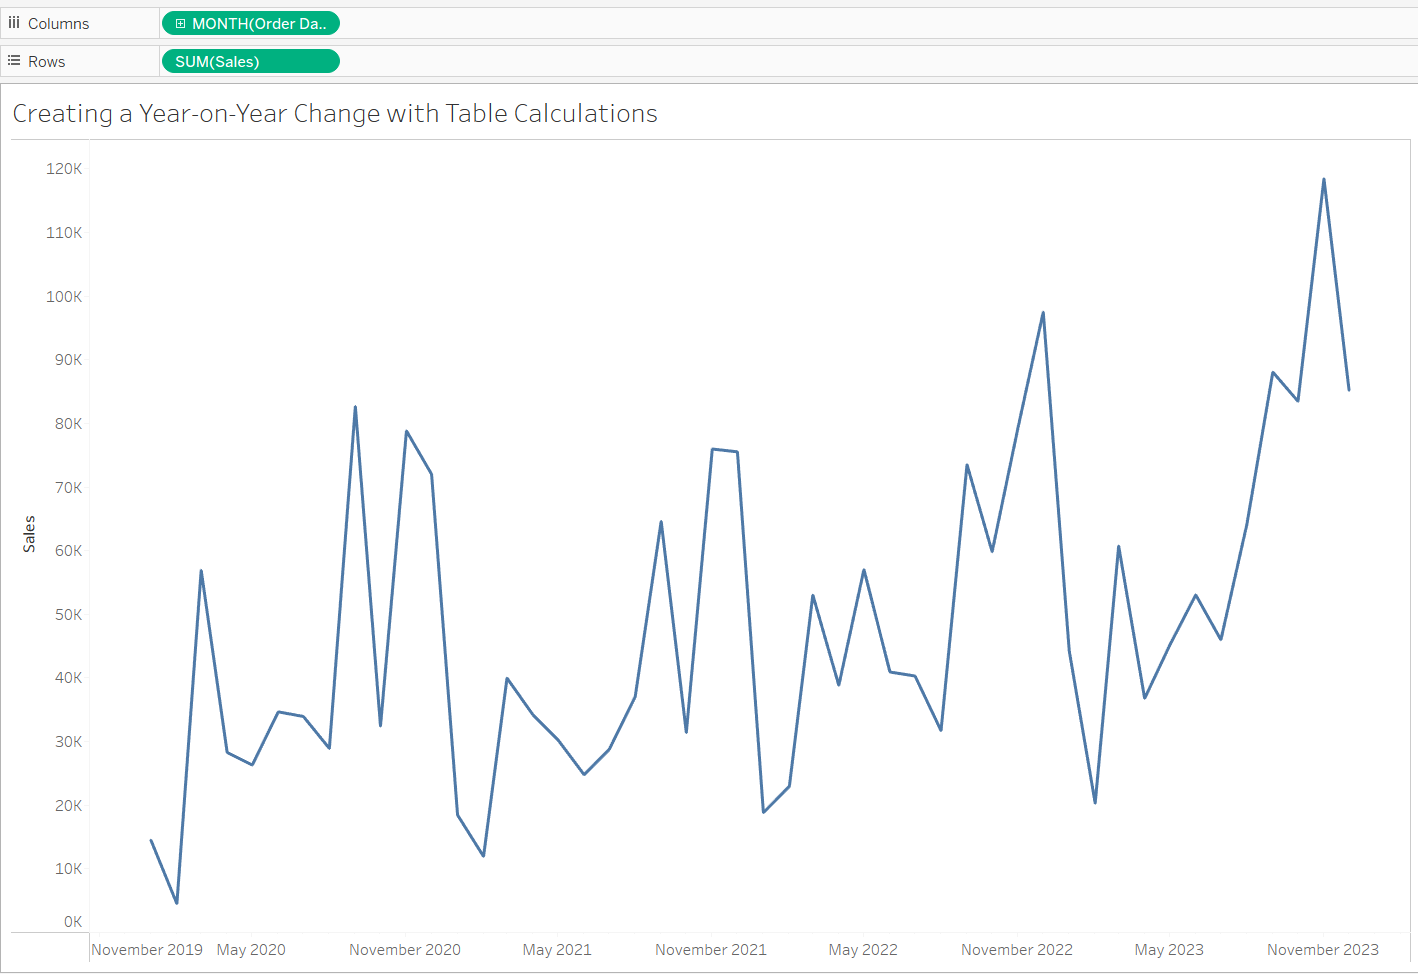
First we should create a basic line chart using the orders table from the Superstore Data in Tableau.
We need to drag the order date onto columns and ensure it is a continuous month and year. Then drag the sales onto rows.
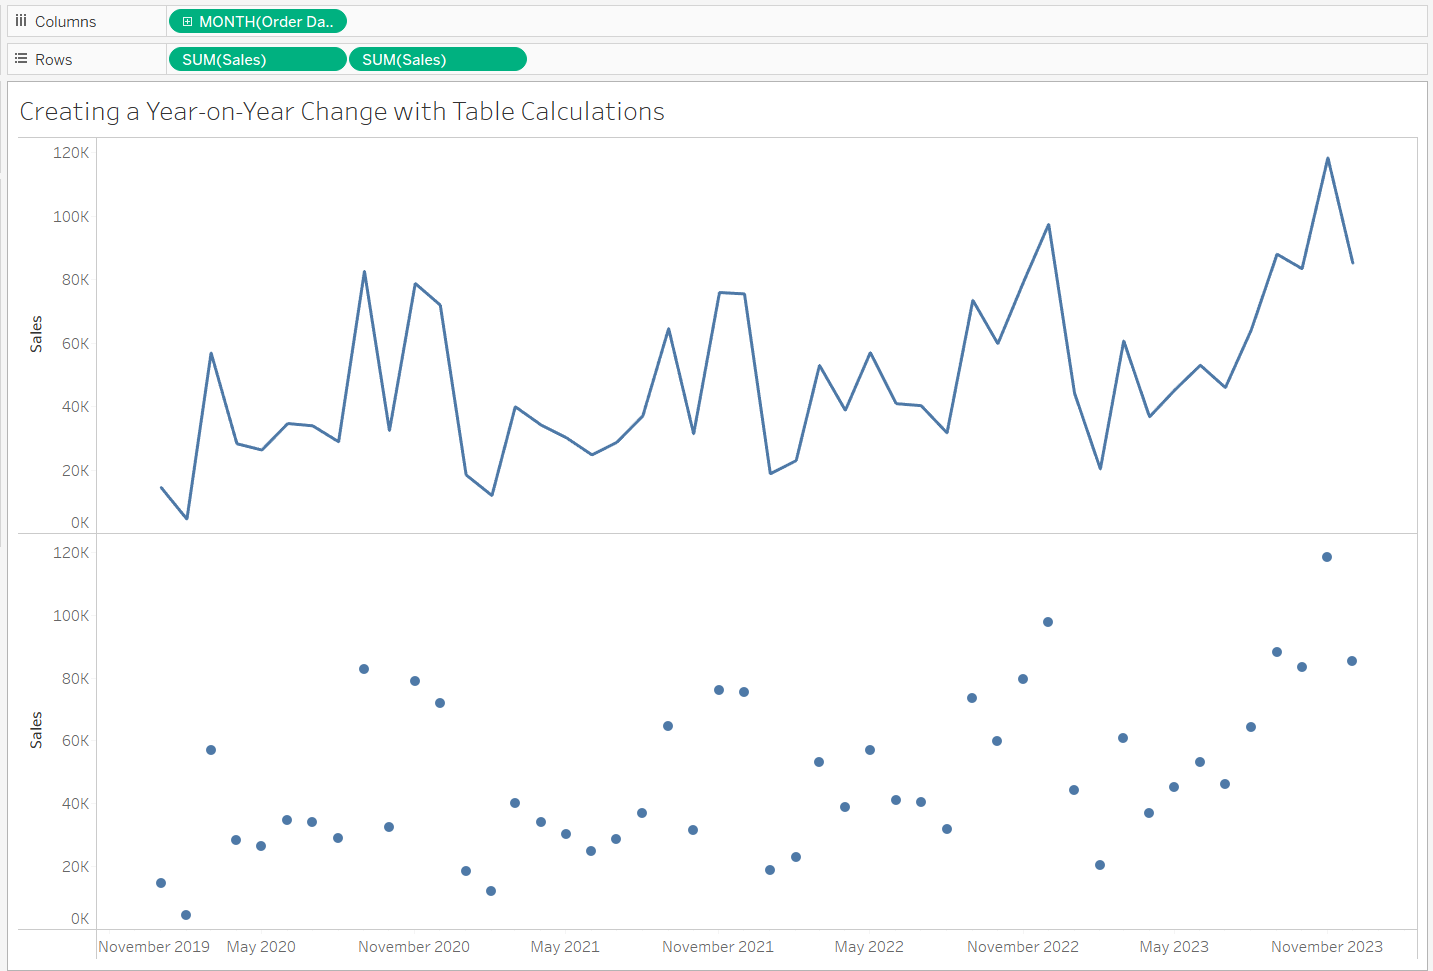
We then need to create a second line chart of circles for each of value of sales by dragging the sales onto the rows again.
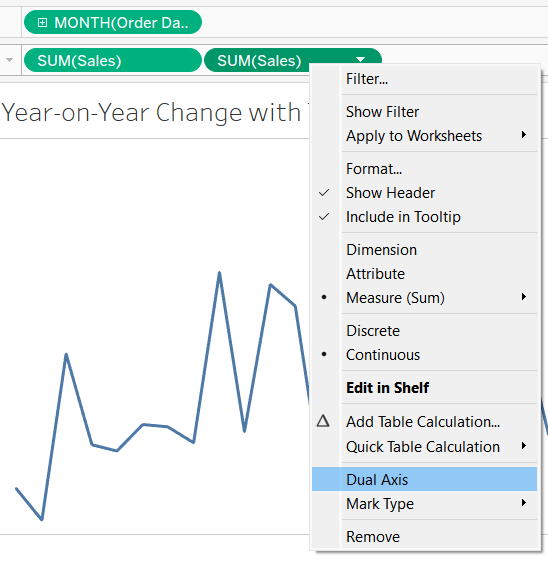
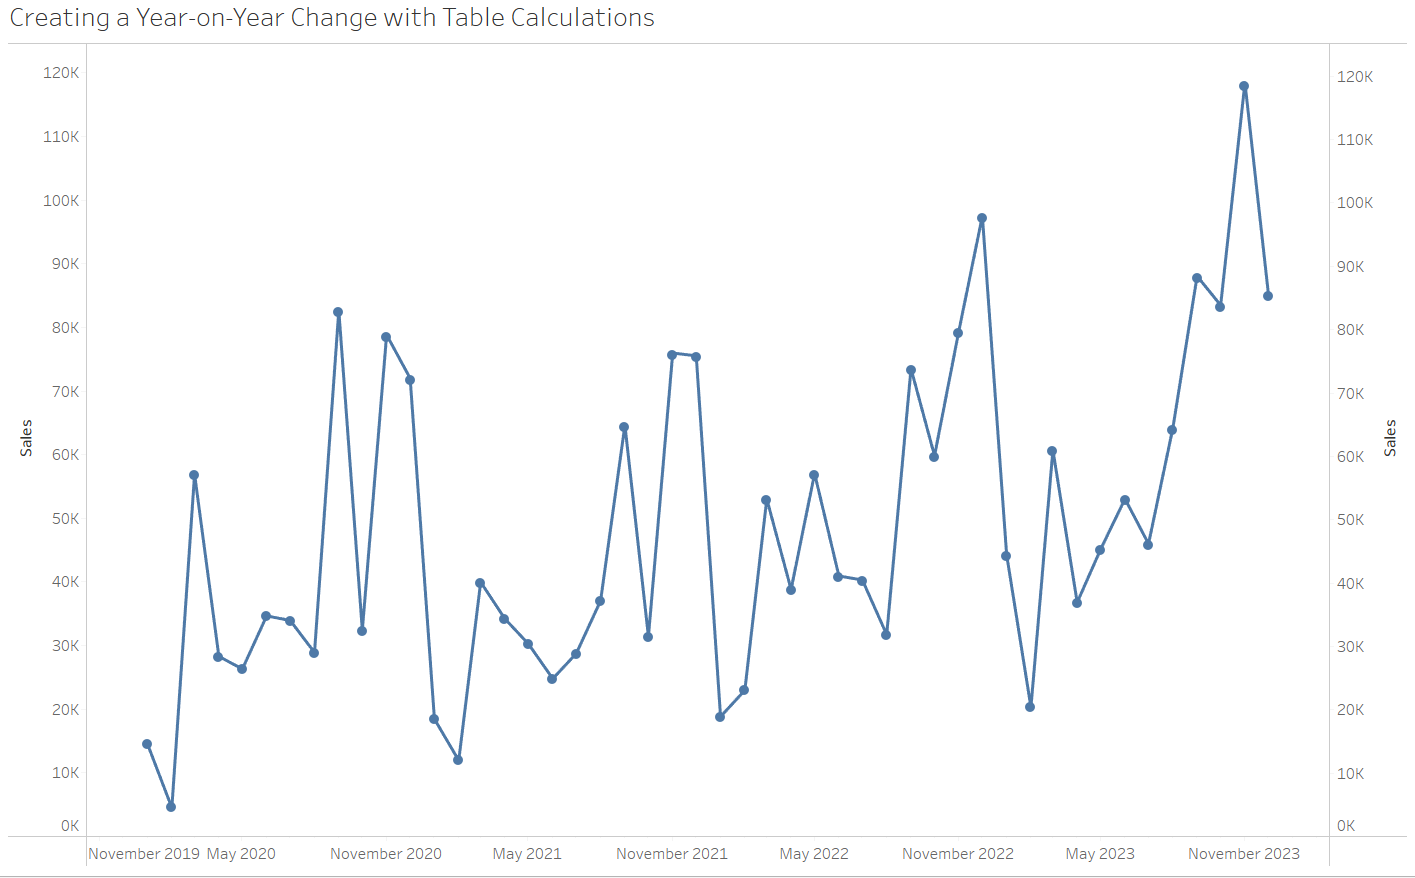
Right click on the second sum of sales on rows and click 'Dual axis' to merge the two charts.
We then used the Last function to colour the line and highlight the value for the current year of sales.
Create a calculated field called 'Last' using the calculation below
LAST()=0This calculations specifies to return the value from the current position in the datatset.
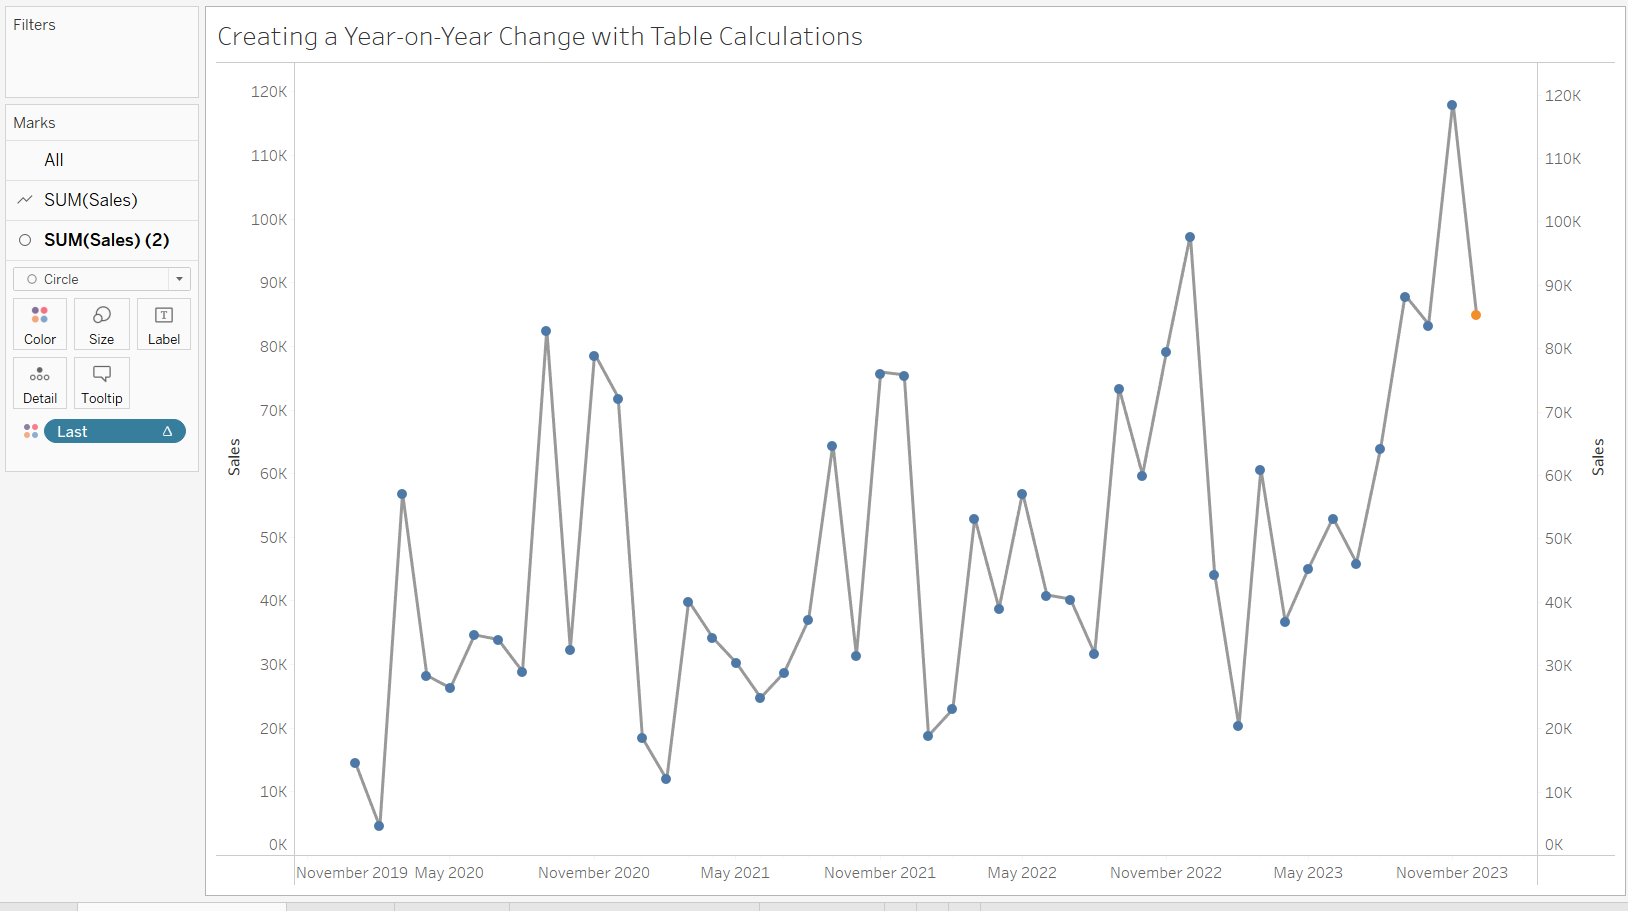
Place the last calculation on the colour mark for the second sales marks cards.
You should get the coloured chart below and the current value coloured from a different colour to other years.
To then ensure we only have the current and previous year values points highlighted we need to duplicate the first last calculation, change the name to 'Last <=1' and use the following calculation
LAST()<=1
This will evaluate whether the value of the specified field in the current row is either the last value in the partition or the second-to-last value as these are the only two values that are required for this chart.
Place this calculation on detail on the second sum of sales marks card. This will remove all dots apart from the last and second to last values, which will result in the final chart
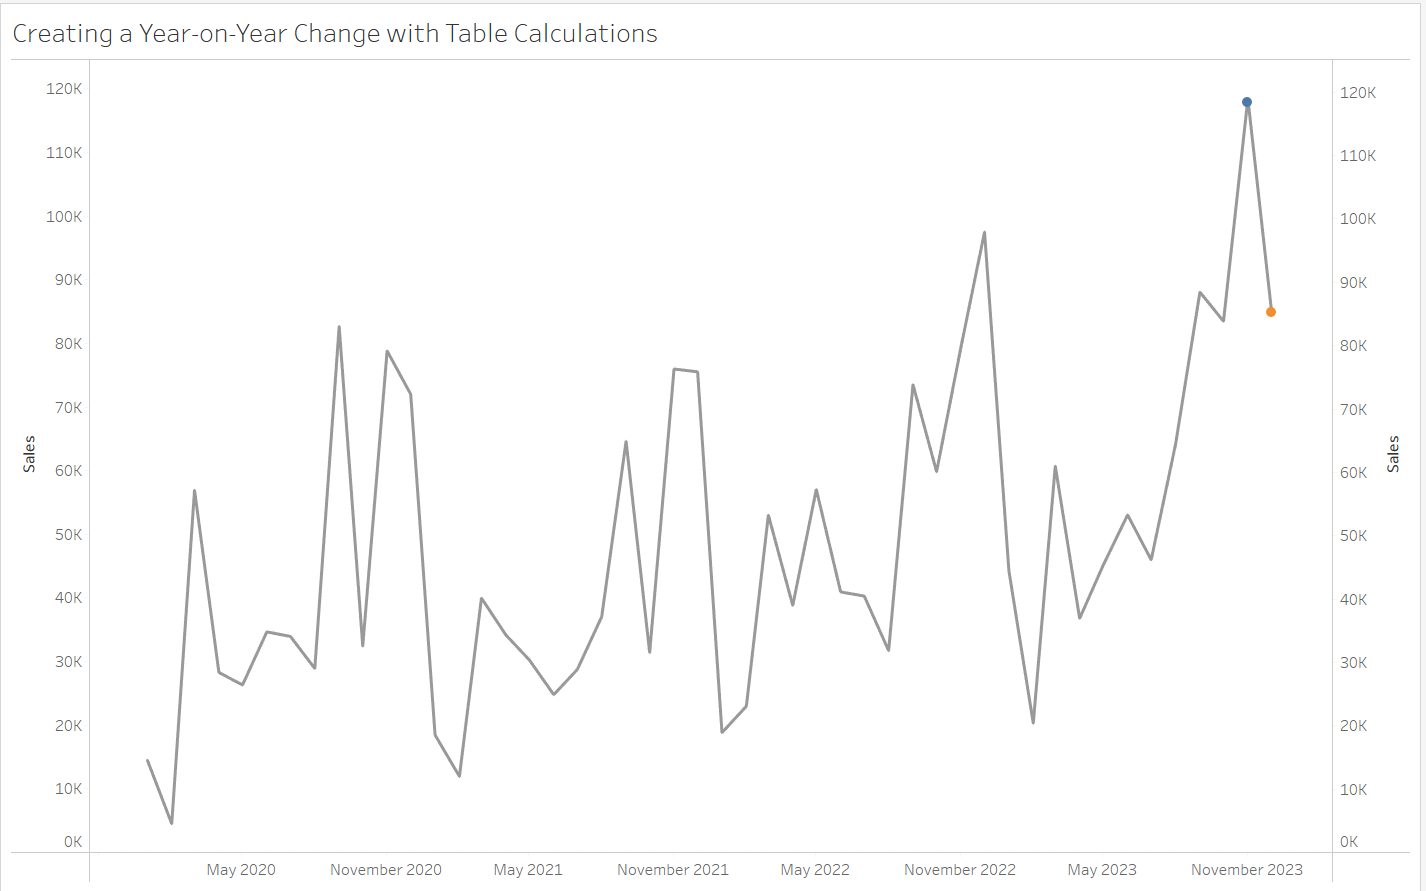
Demonstrating year-on-year comparisons are an important function in many industries and table calculations provide an easy methods to achieve this.