


Small multiple charts are an excellent technique to convey complex information with clarity and efficiency. They allow us to compare multiple datasets side by side, offering insights into patterns, trends, and variations that might otherwise go unnoticed.
Small multiples involve creating a series of charts, typically of the same type, each representing a subset of the data. These charts are arranged in a grid, with each chart displaying a different slice or aspect of your dataset. By presenting information in this way, small multiples enable viewers to easily compare and contrast various segments of the data, facilitating deeper insights and understanding.
To create a small multiples bar chart looking at profits for subcategory over time such as the one in the image above, we can use the Orders Table in the Tableau Superstore Data.
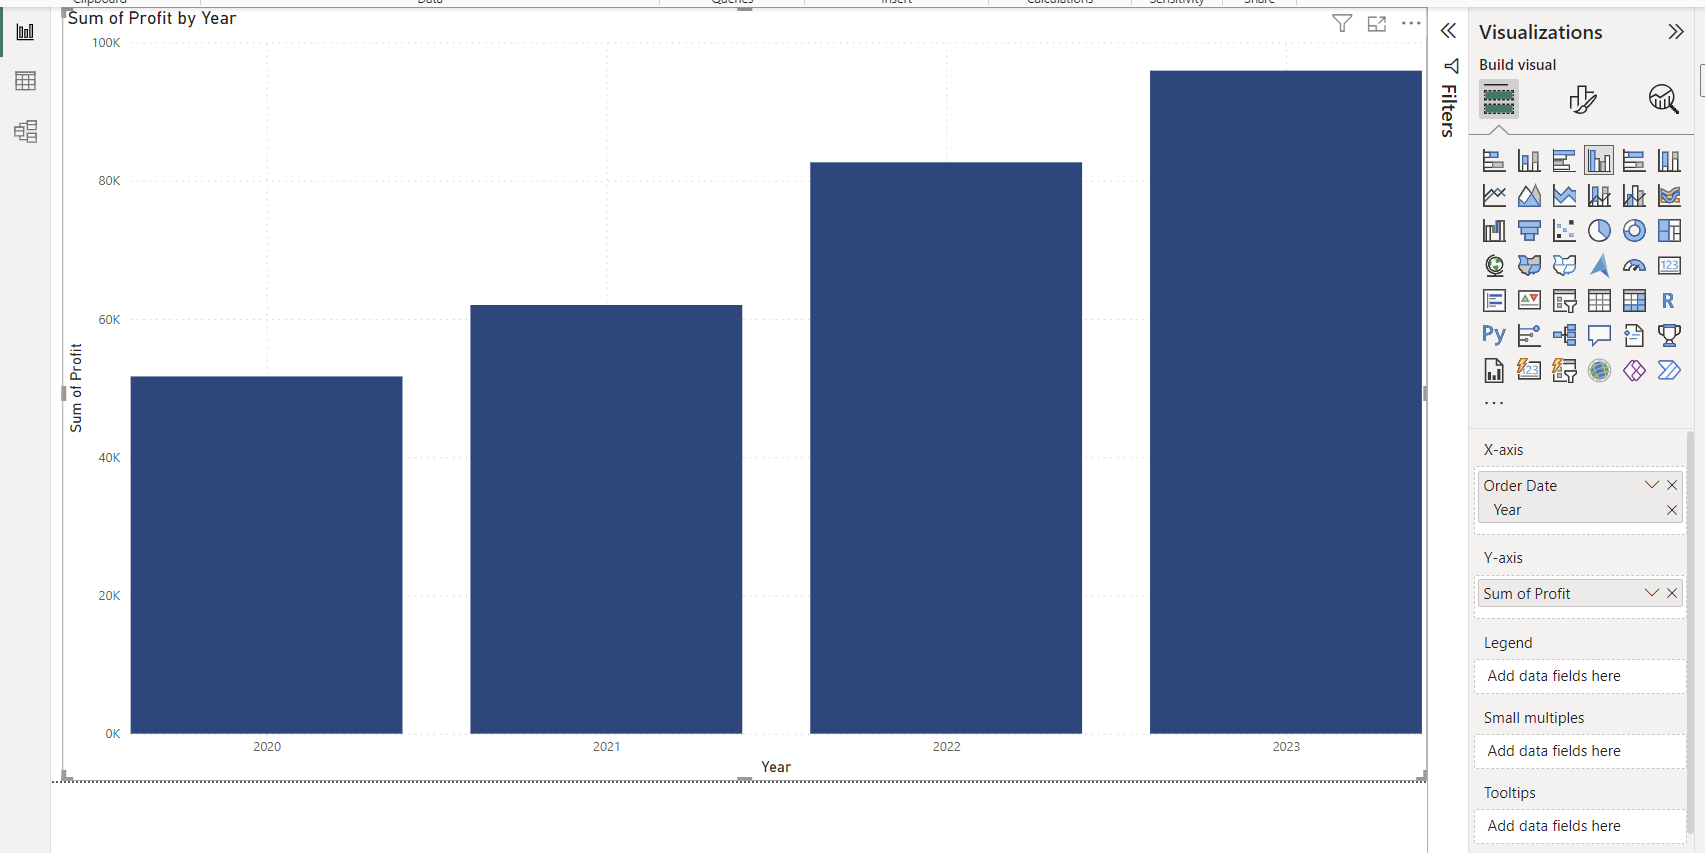
First, we need to create a basic bar chart. To do this, we can put the order date on the x-axis and the profits field on the y-axis.
To turn the single bar chart into a small multiples, we need to add the subcategory field to the small multiples area in the visualisation pane.
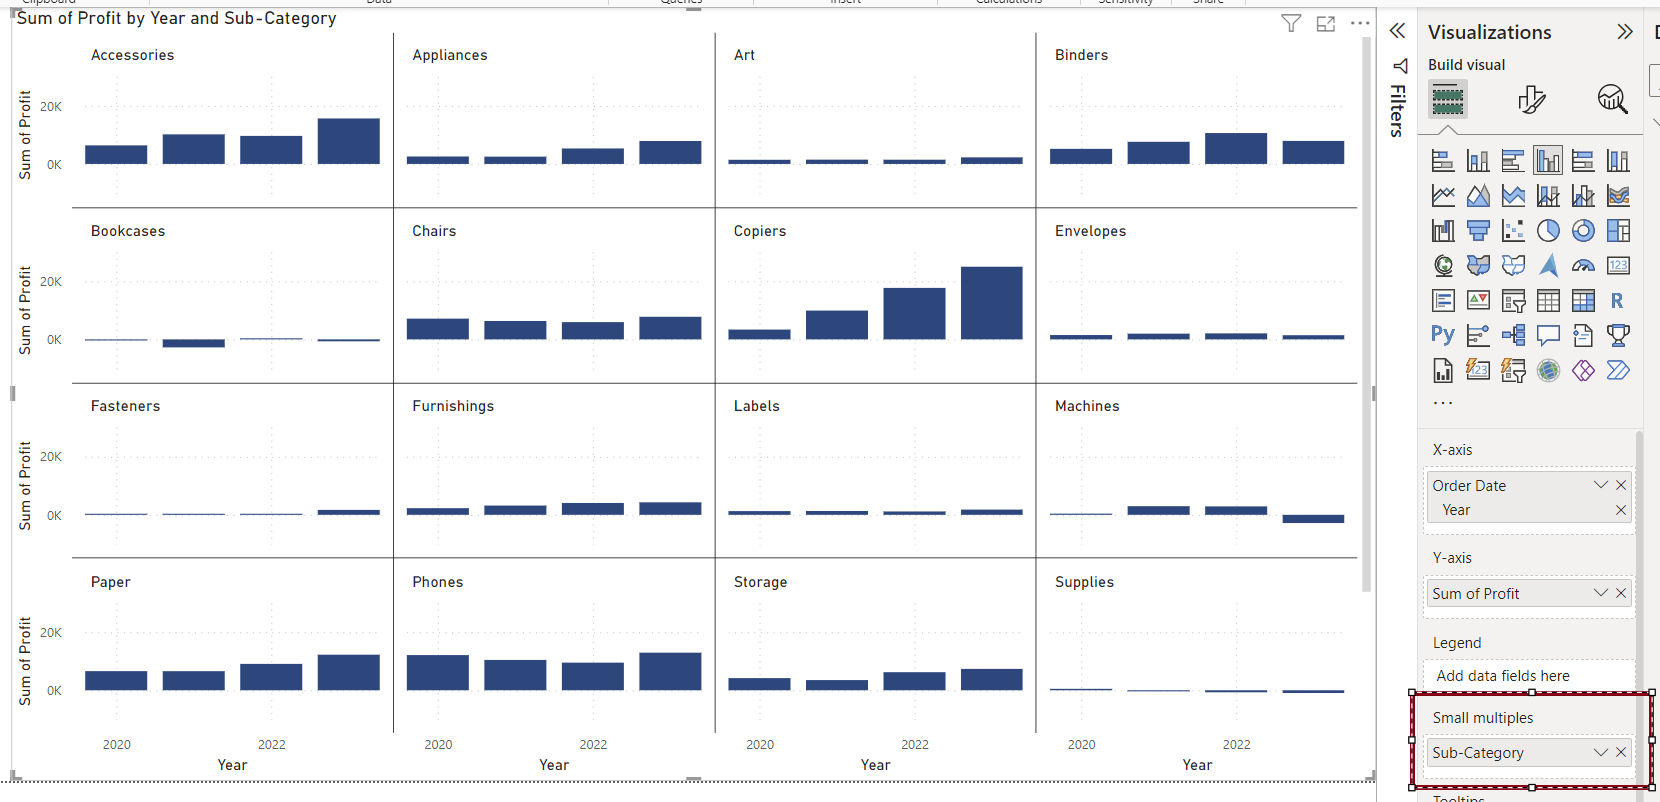
We can specify the number of charts within each row and column using the visual your pane and navigating to the small multiples option.
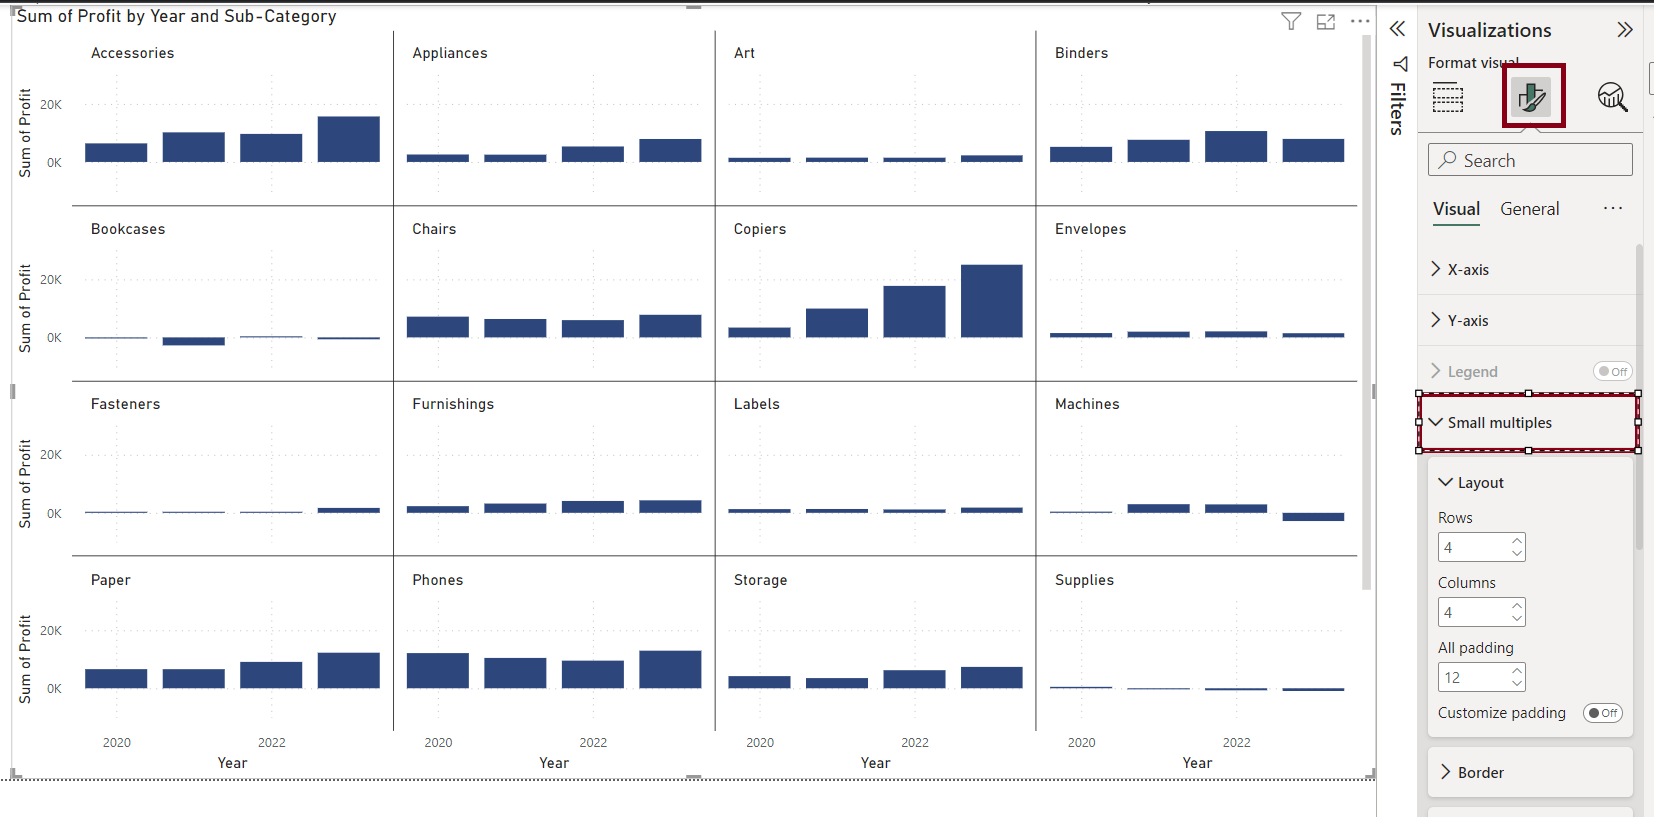
Here you can adjust the numbers for rows and columns as well as the padding of the charts if required.
It's that easy!
Whether you're analyzing sales trends, tracking key performance indicators, or exploring patterns in scientific data, small multiples can be a game-changer in your data visualization toolkit. Experiment with different chart types, layouts, and interactive features to find the approach that best suits your needs, and unlock the full potential of your data storytelling efforts.