


Creating dimensional parameters in PowerBI Desktop allows your data to be more dynamic by changing the context of your report by selecting different values such a dates and other categories to switch between graphs such as in the short video below.
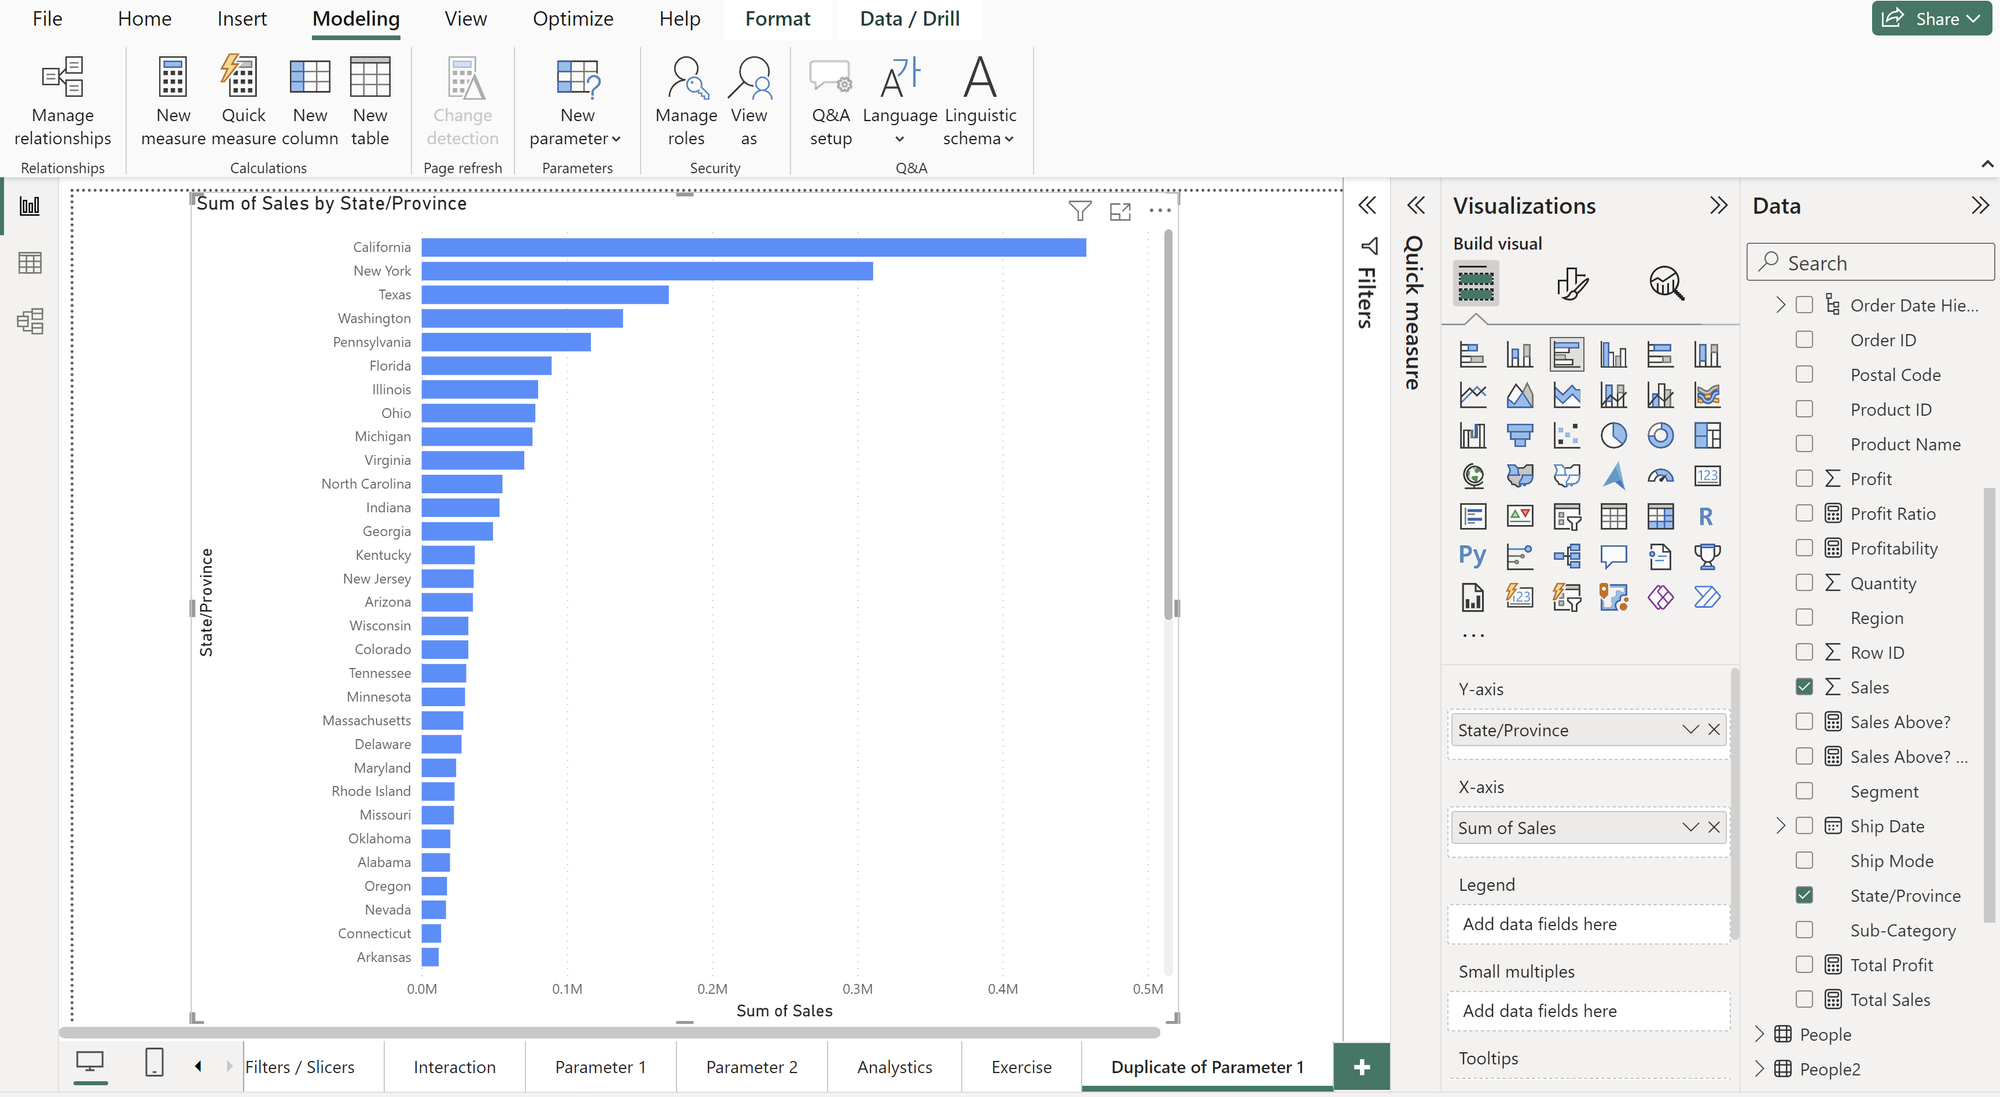
To create these, first you would need to create you chart with one of the categories you intend to use in your dimensions parameter. In the example below, we created a bar chart of sales by state/province from the Tableau Superstore dataset.
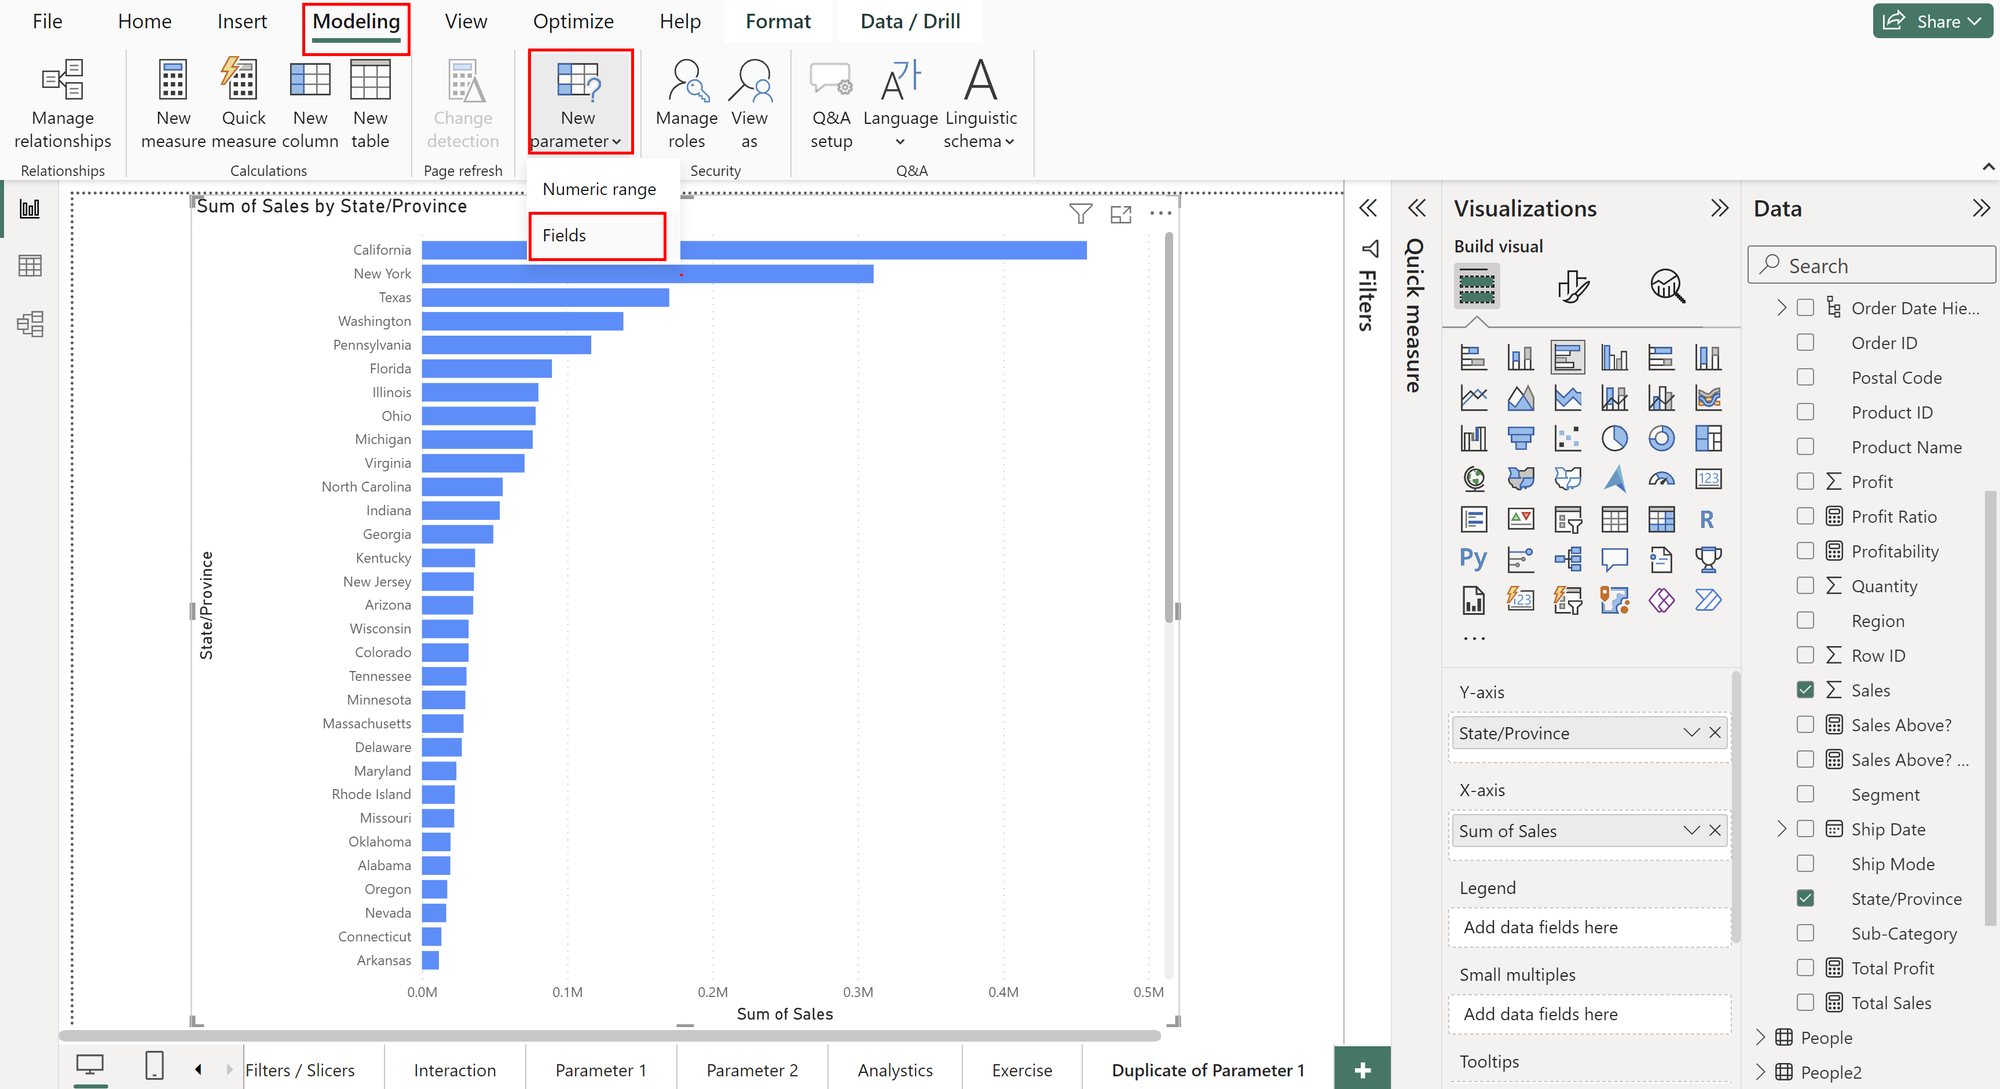
We then need to select the barchart and navigate to the 'modelling' tab and select 'New parameter'. As we want to create a parameter using some of the fields within the dataset, we would need to choose 'fields'.
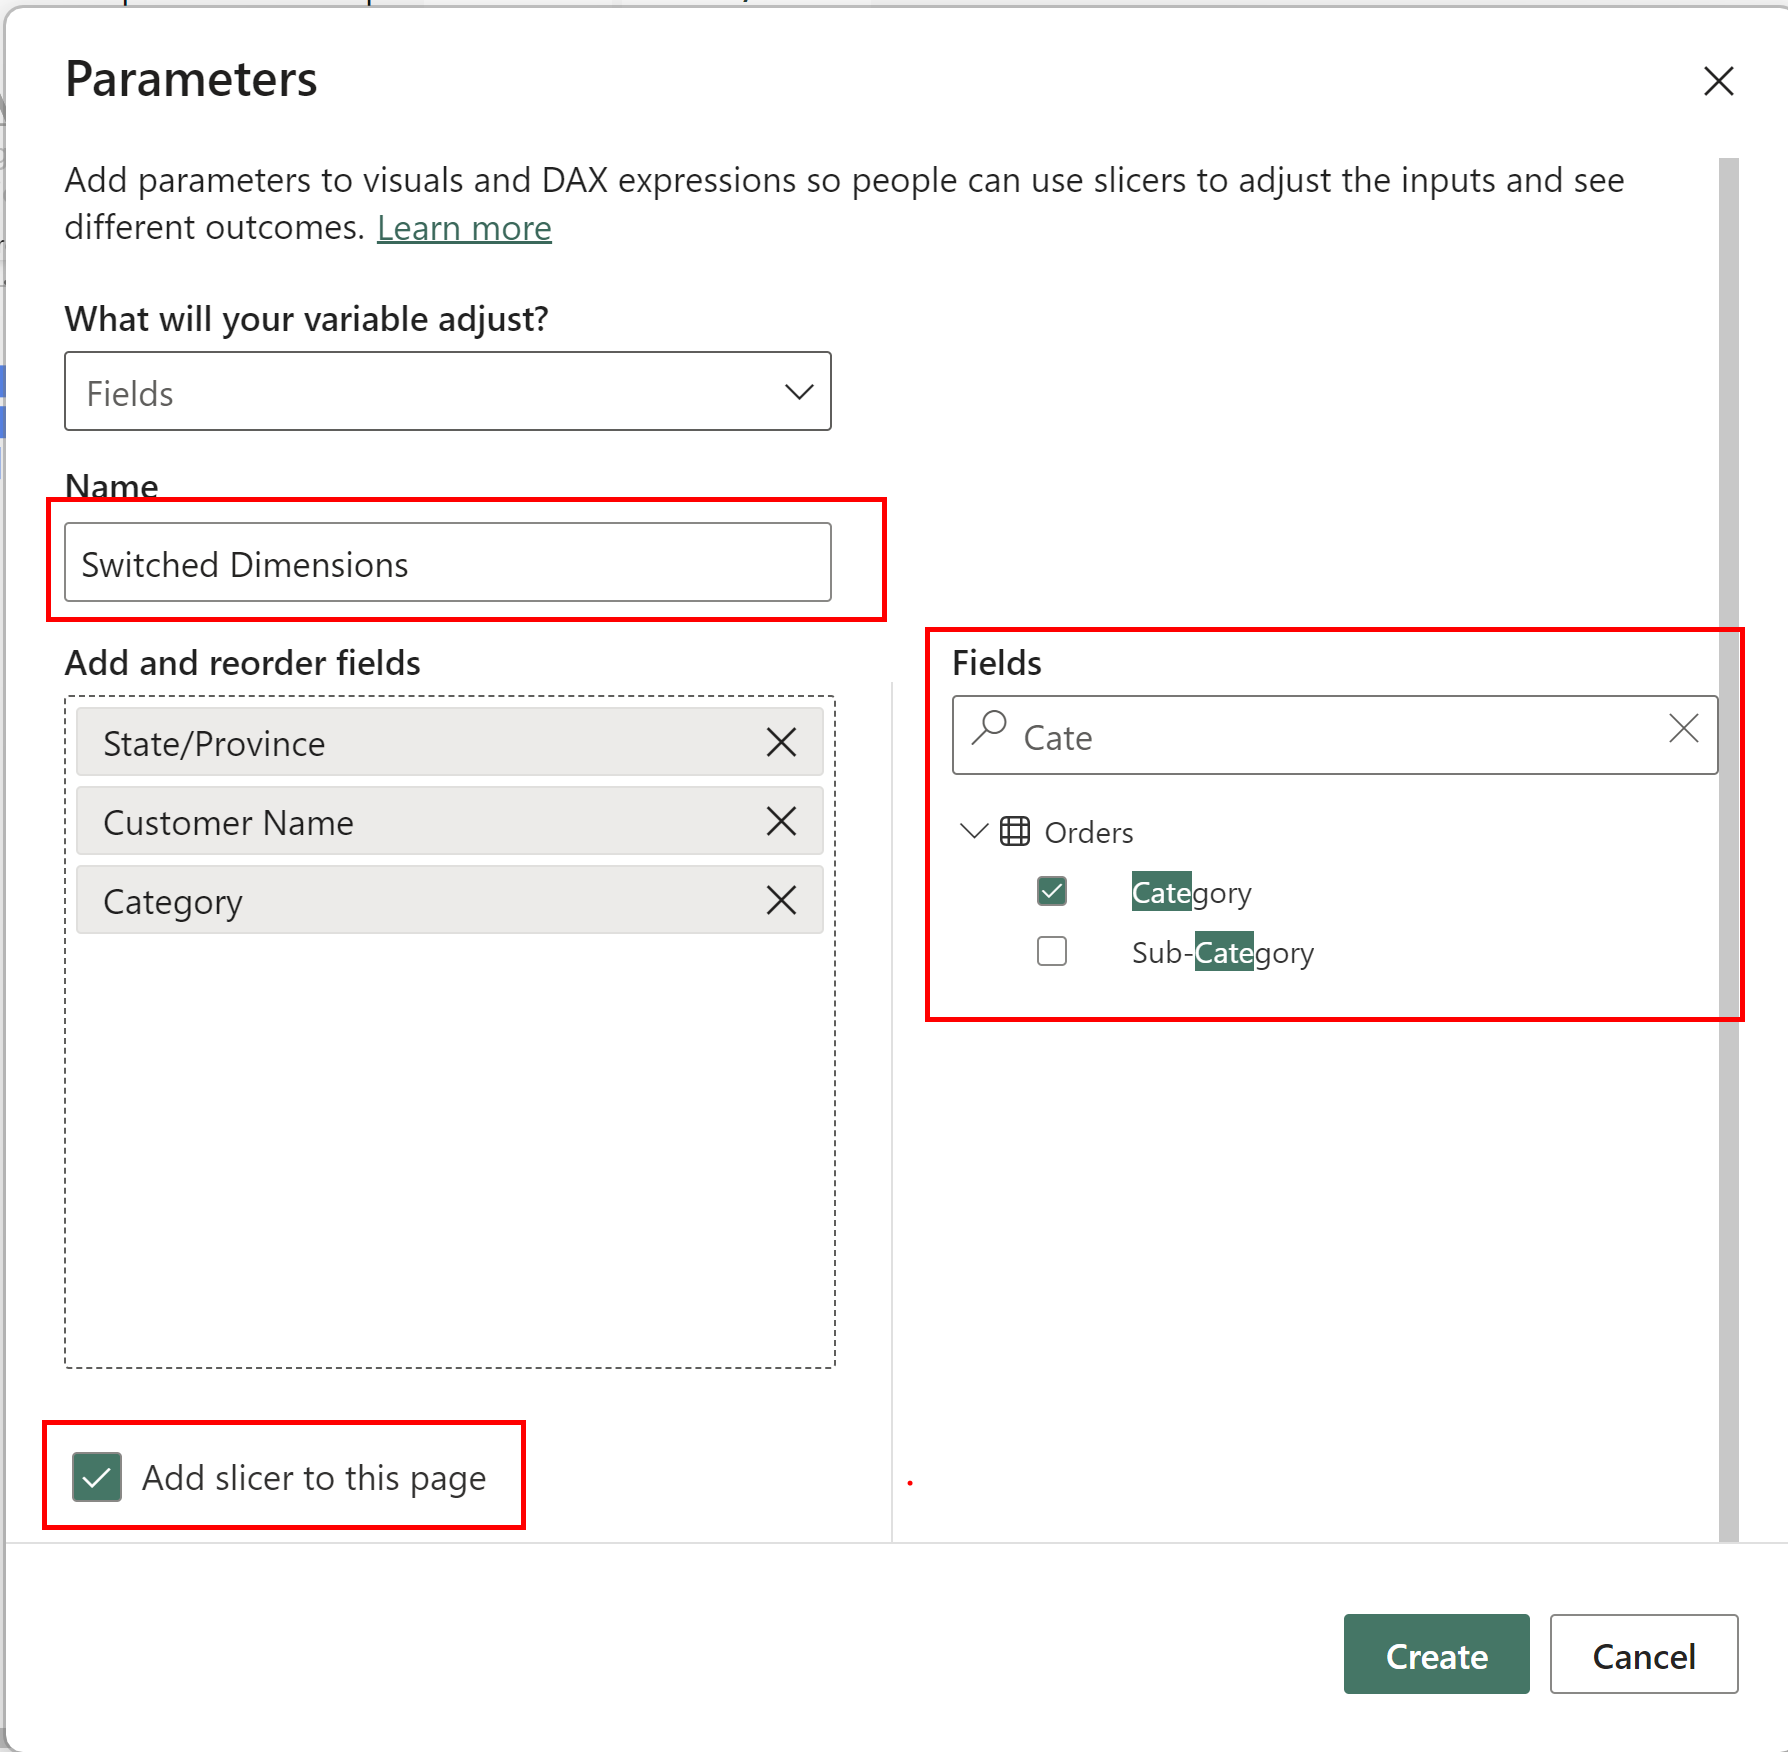
This will bring up the parameter creation tool. We then need to rename the parameter in the Name Box (here we called it 'switched dimensions' and choose the fields which you want to visualize in the different charts. You can search for specific fields within your data in the search box above the list. Then check the box for the required fields to add them to the 'add and reorder fields' box.
Make sure to check the box 'add splicer to this page'. This will add the list to filter through the fields to the PowerBI page, then click create.
This creates a 'splicer' in the page which contains the categories and a new 'fake' table in the data pane.
In order to allow for the filtering between the fields in the bar chart, we need to select the bar chart in the page, then replace the 'state/province' field in the y-axis with the new 'switch dimensions' parameter.
This should allow filtering between fields on the bar chart.