


Within Tableau, forecasting becomes not just a feature but a dynamic tool that empowers users to predict future outcomes based on historical data patterns. This can be used in a variety of different scenarios including sales trends, demand forecasting, or financial projections.
Some important considerations to make when forecasting in Tableau are
Data Quality
The accuracy of your forecasts is influenced by the quality and quantity of historical data available. Ensure that you have sufficient historical data covering a relevant time period to identify meaningful patterns and trends.
Choosing the Right Model
Tableau offers several forecasting models, each suitable for different types of data and patterns. It's important to choose the right model that best fits your data characteristics and business objectives. Experiment with different models, such as exponential smoothing, linear regression, or ARIMA, to determine which one produces the most accurate forecasts for your data.
Seasonality and Trends
Many real-world datasets exhibit seasonality and trends that can significantly impact forecasting accuracy. Tableau provides features to detect and account for seasonality, such as seasonal decomposition and seasonal indices. Consider incorporating seasonality and trend analysis into your forecasting process to capture these patterns and improve forecast accuracy.
By considering these important factors when forecasting in Tableau, you can enhance the accuracy, reliability, and usefulness of your predictions.
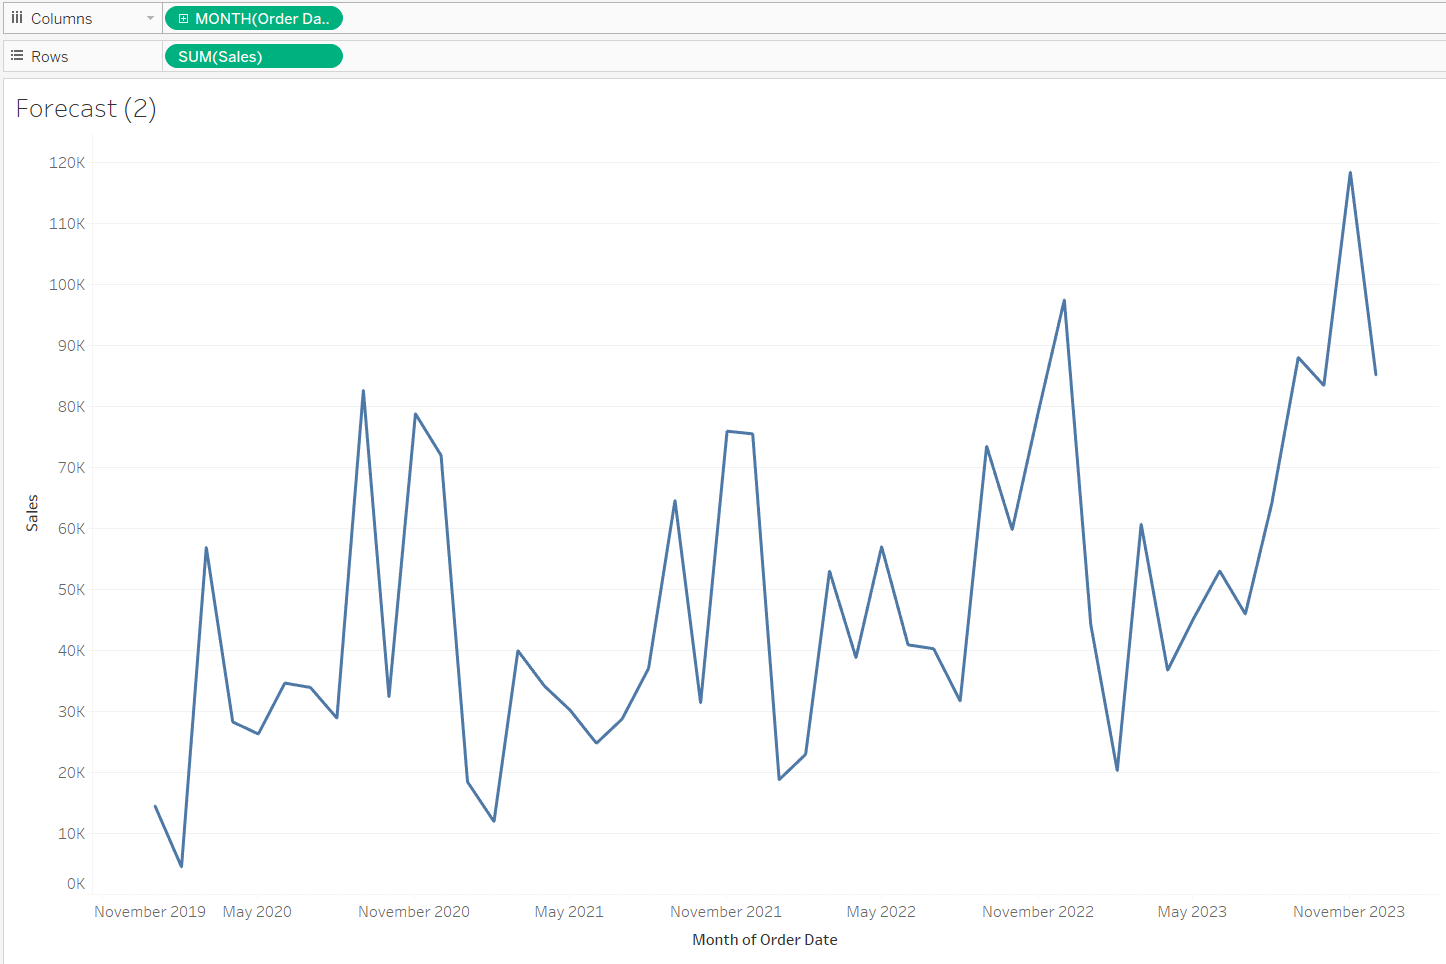
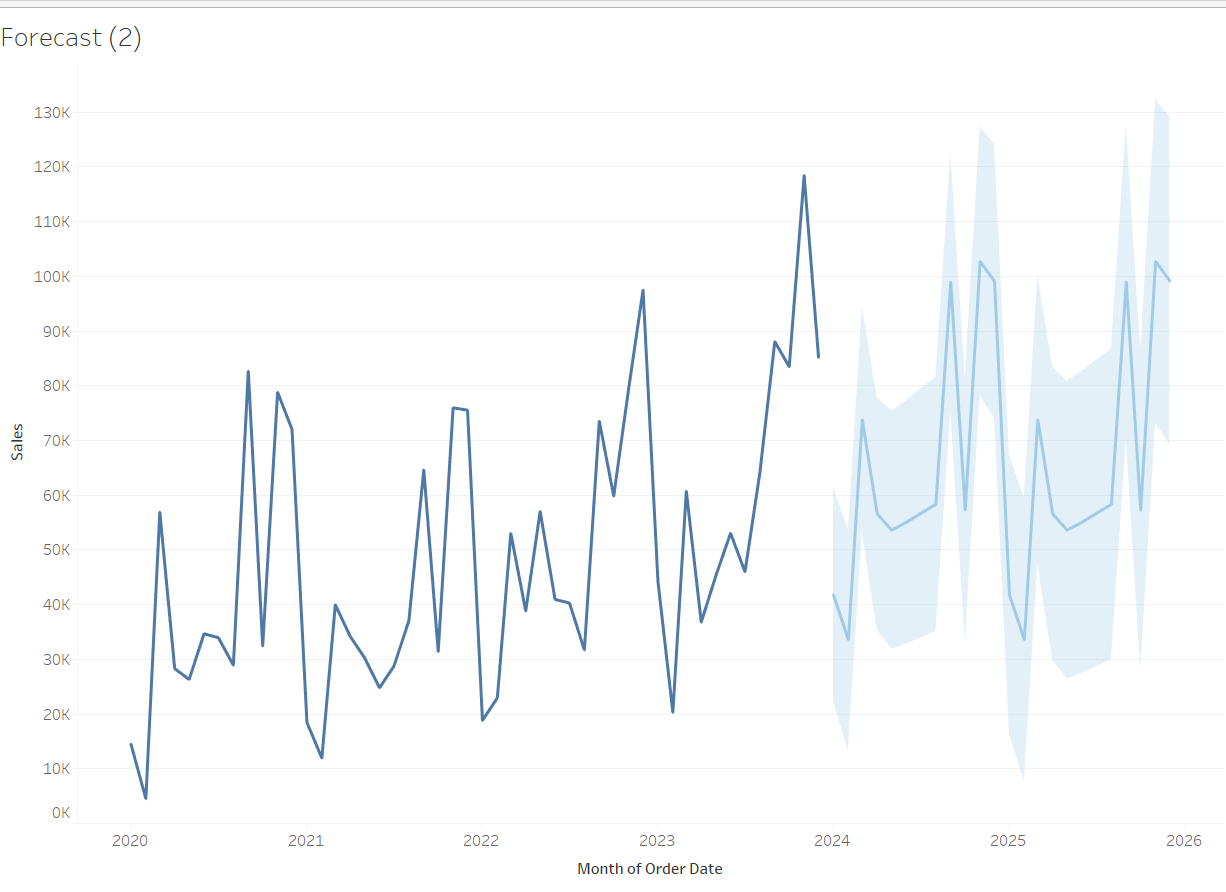
To create a forecast, we can first create simple line chart using the Tableau Superstore Data. We first drag order date onto columns and sum of sales onto rows. Make sure order date is changed to month and is a continuous measure.
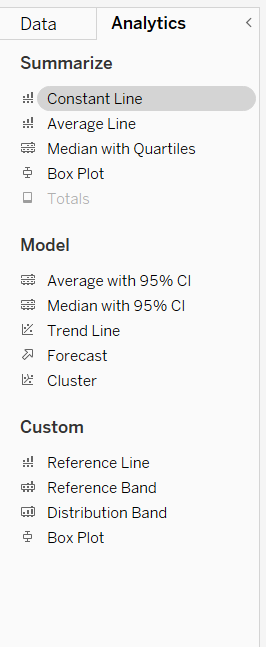
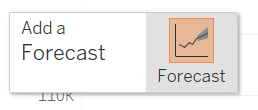
The forecasting tool can be found in the analytics pane on the left. Just drag the forecast onto the 'add a forecast' square on the visualisation pane.
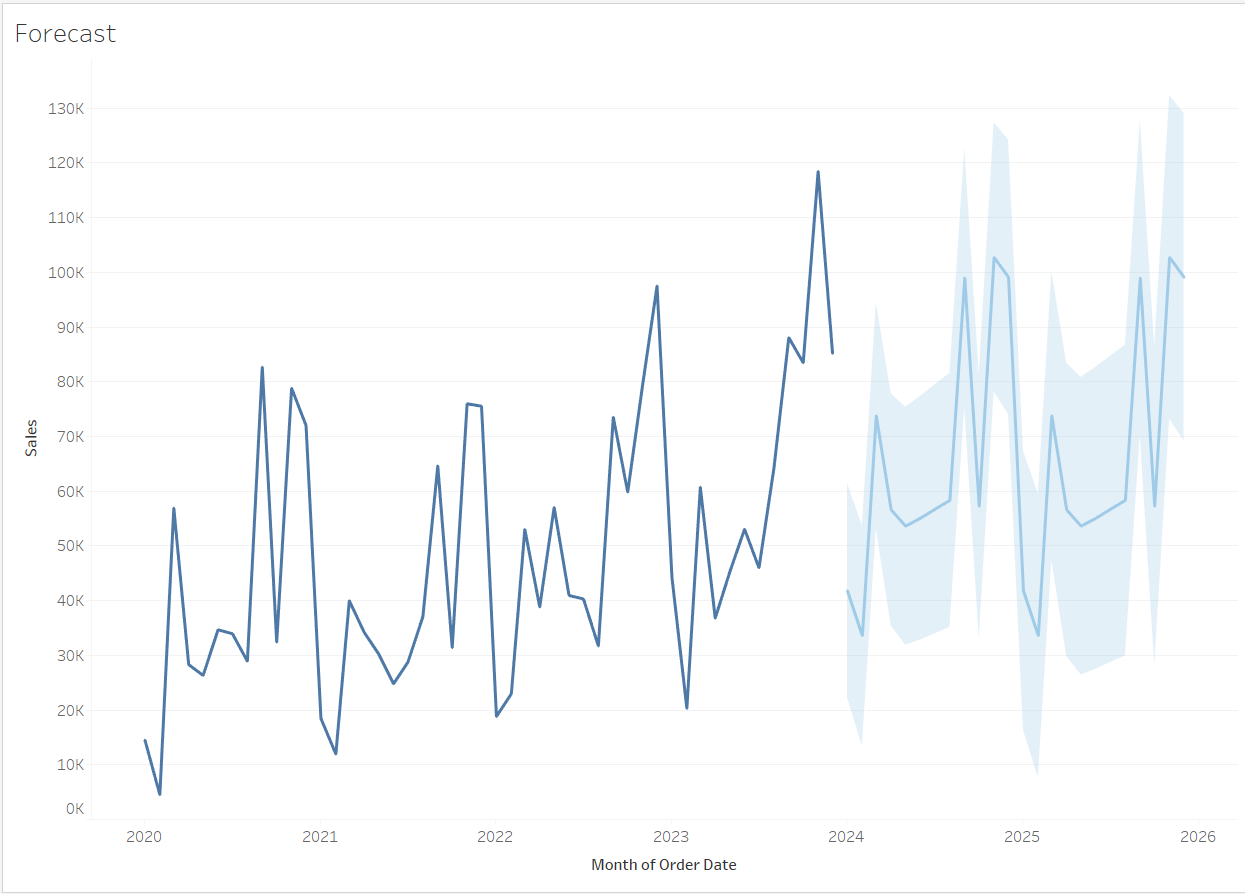
This will then add a forecast line to the chart:
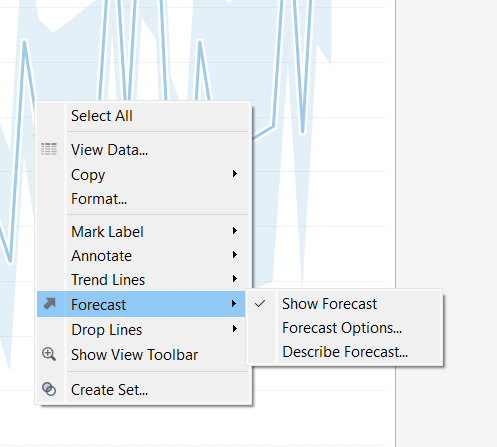
If needed, you can format the forecast line by right clicking the forecast and choosing forecast options.
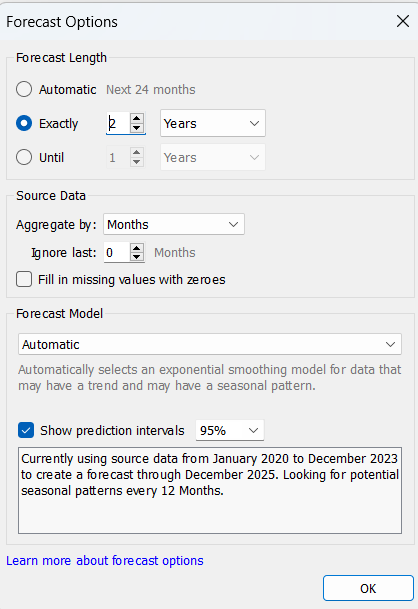
You can then choose the forecast length and the model type as well as other options
Forecasting is a powerful tool for anticipating future trends and making informed decisions. With Tableau's intuitive interface, flexible forecasting models, and extensive customization options, users can unlock valuable insights from their data and gain a competitive edge in today's dynamic business landscape. By embracing best practices and leveraging Tableau's capabilities, organizations can harness the predictive power of data to drive growth, innovation, and success.