


This week in DS43 cohort, we learned how to create spatial maps within Tableau, and Power BI. One of the map types we created that I thought could be really useful is flights from a specific destination (thinking for future holiday planning of course....).
Spatial analysis plays a crucial role in uncovering insights across geographic areas and can be used in a multitude of scenarios, such as the one below.
The map above makes use of the MakePoint, MakeLine and Distance Functions within Tableau. It shows flights destinations out of and within a user defined distance of JFK airport.
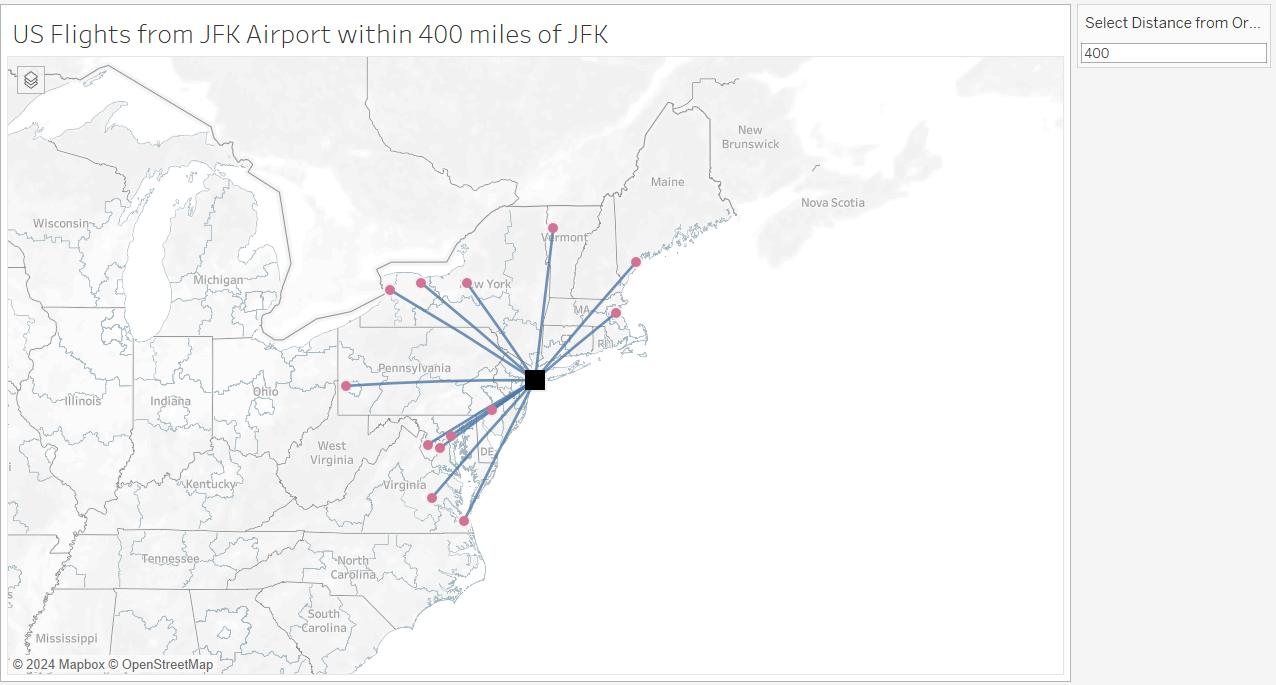
The MakePoint function in Tableau allows users to create spatial points based on latitude and longitude coordinates. This function is particularly useful when dealing with datasets that contain location information.
The MakeLine function takes spatial analysis to the next level by connecting these points with lines. This function is invaluable when analyzing movement, routes, or connections between different geographical entities.
The steps below outline how to create the above graph:
1) Create the Origin airport point using the latitude and longitude for the origin airport using a calculated field:

Then do the same for the destination airports
2) Drag the origin airport point calculation onto the visualization pane, which will create the map displaying with the origin airport point.
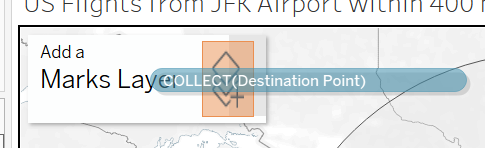
3) Drag the destination airport point calculation on the the visualisation pane and drop it on the 'Add a Marks Layer' option in the top left corner of the window (shown below). This will create another marks layer in the
4) To show the individual dots as the separate airports, drag the origin and destination airport name field onto detail under the corresponding marks card.
5) To create the joining lines between the origin and destination points, create another calculation with the makeline function using the two point calculations you previously created.

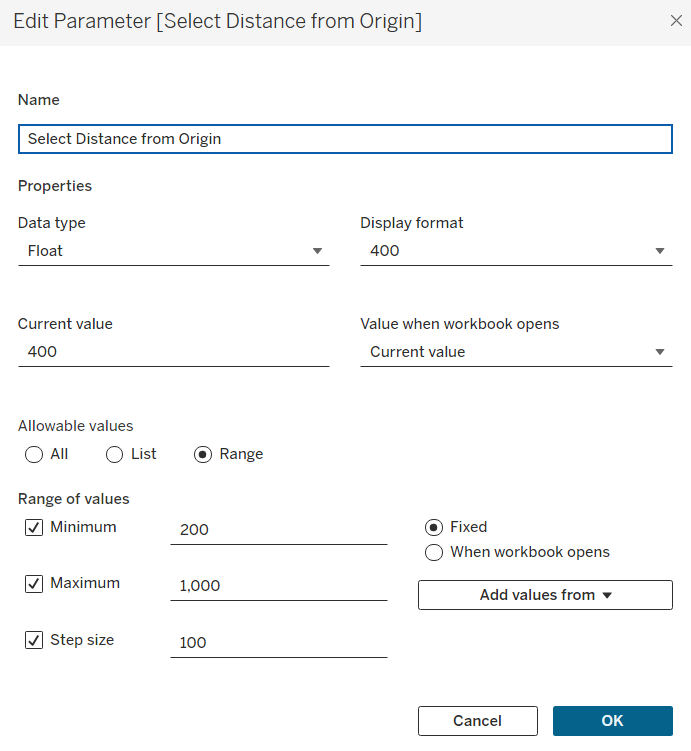
6) To users the option to control the distance from the origin airport, create a parameter with the specifications below:
7) Then create a calculation using the distance function to filter the destination airports based on the specified distance in the parameter:

Here., 'mi' refers to miles but other distance metrics can be used. Unfortunately, there is no option yet to specify time for distance within Tableau just yet.
8) Place the calculation on filter and show the parameter.
And there you have it! We've created the flights between the origin to destination airports. To can format the points and lines to your own preferences.
Hopefully, this will be useful in developing your own Tableau and you'll think of multiples uses for these types of graphs. I, personally would like to look more in using it for cases of animal distribution tracking animal species (got to use my university degree for something....).