Creating an intuitive Tableau dashboard is an art, but sometimes even the most user-friendly dashboards require additional guidance for users. Adding a help overlay can provide essential instructions or context, ensuring that your audience understands how to navigate and interpret the dashboard.
One creative way to add additional guidance for users to help navigate a dashboard is by integrating a help overlay using Google slides as a dynamic content layer. This approach is particularly helpful when the instructions need to be updated frequently without editing the Tableau dashboard itself. Here's how you can set it up.
Add a Placehold Image & Export Dashboard
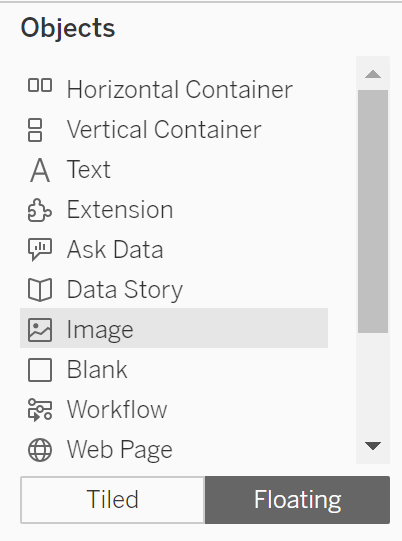
On your chosen dashboard, add a floating image (this will simply act as a placeholder for the overlay for the time being), then in the image menu, add a show/hide button
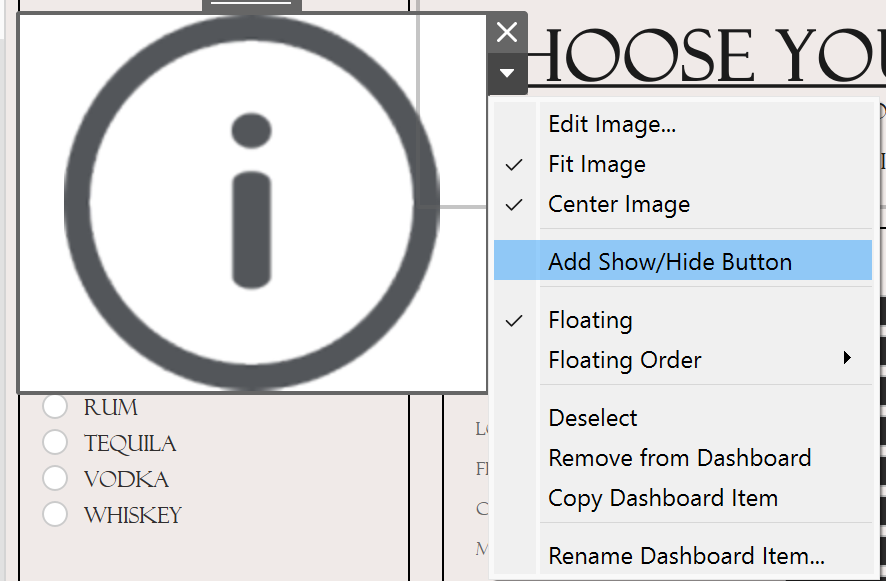
Position and resize the show/hide button as required and hide the image by resizing it to 1x1 for the moment.

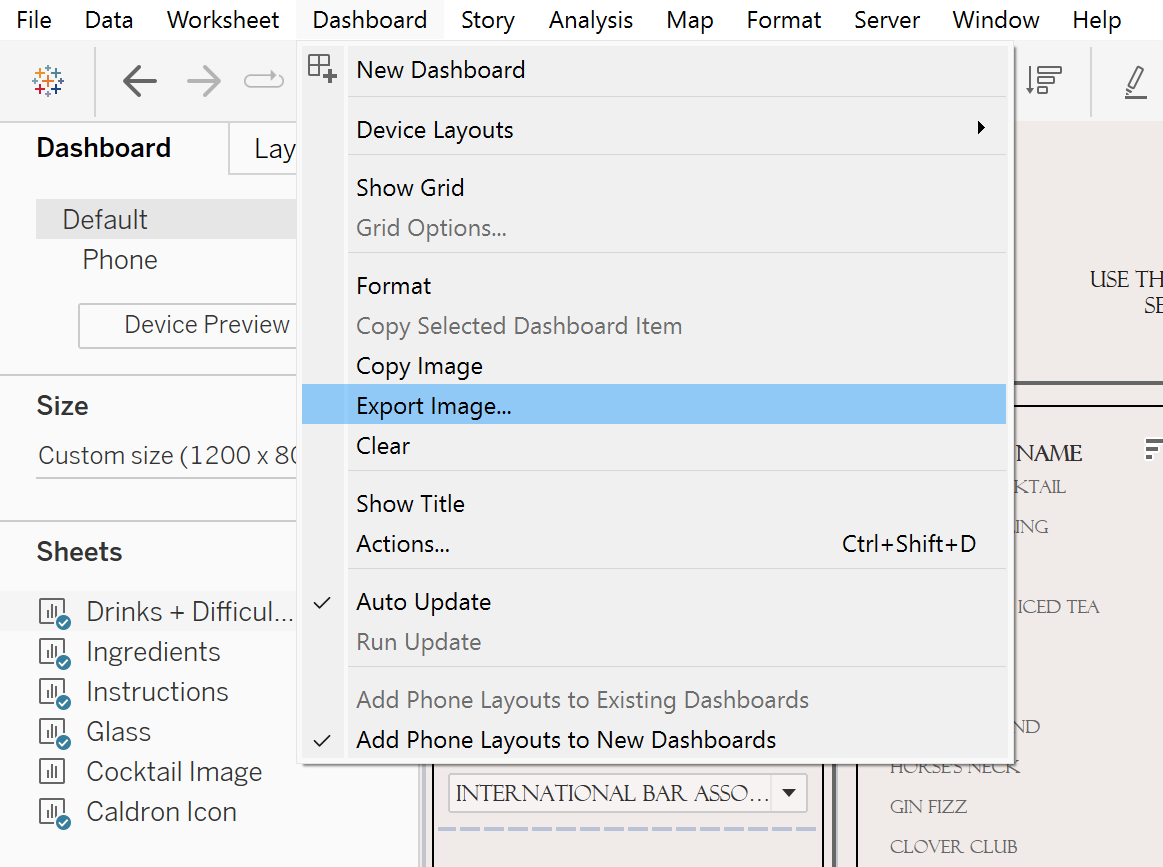
Export and save your dashboard as an image under the dashboard tab.
Create the Help Overlay in Google Slides
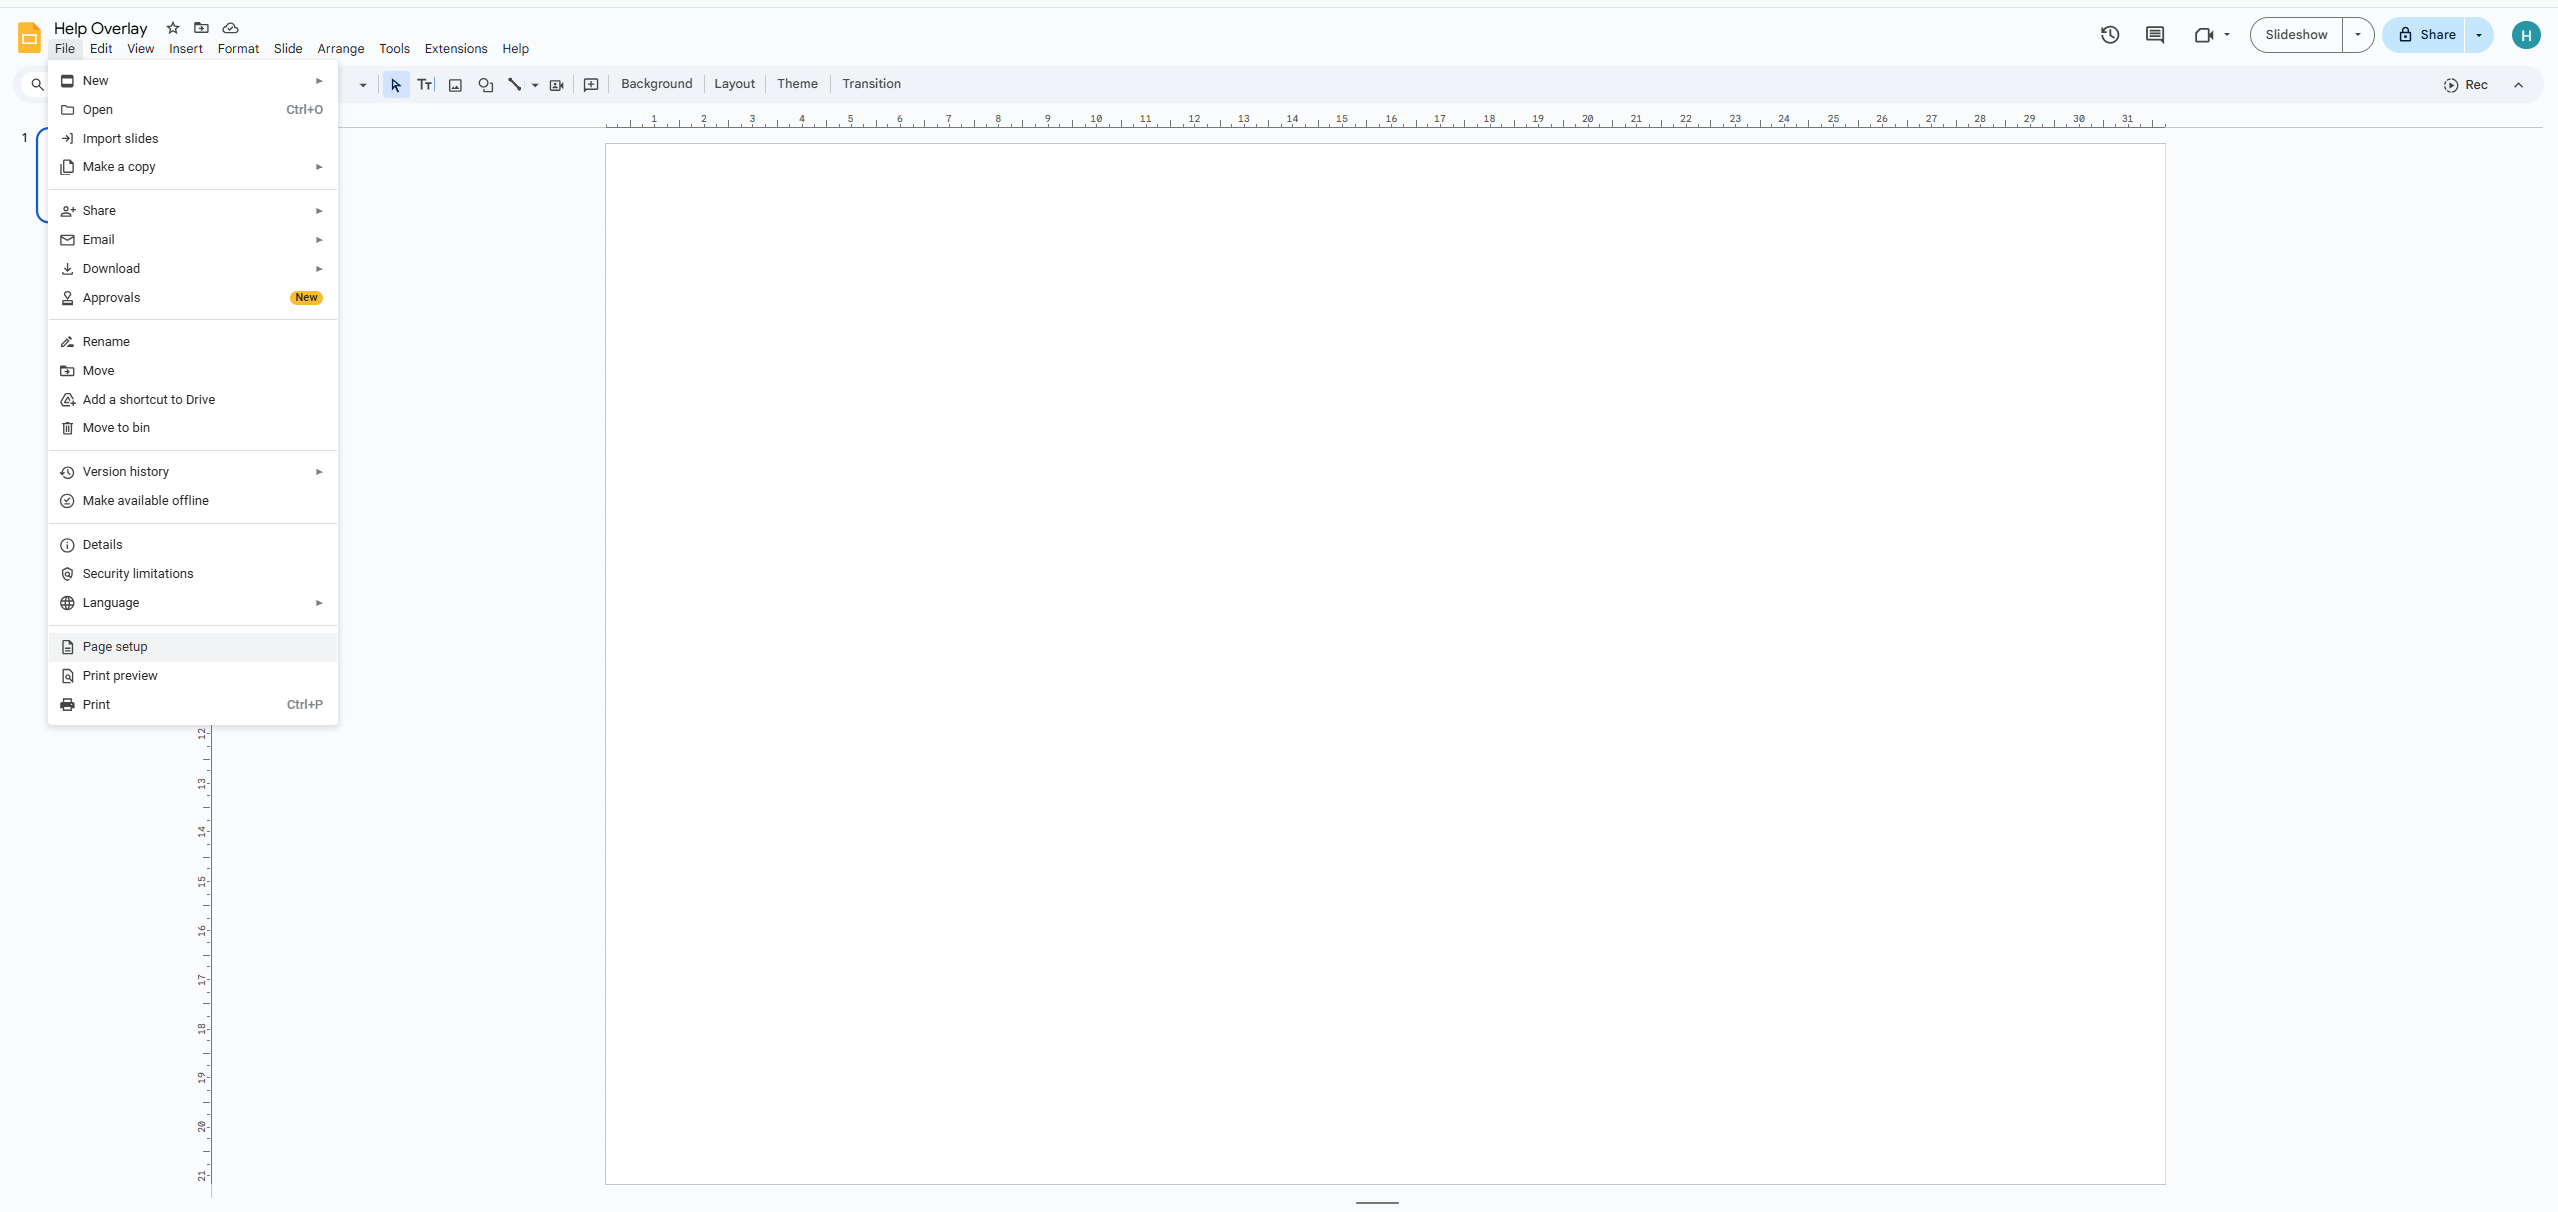
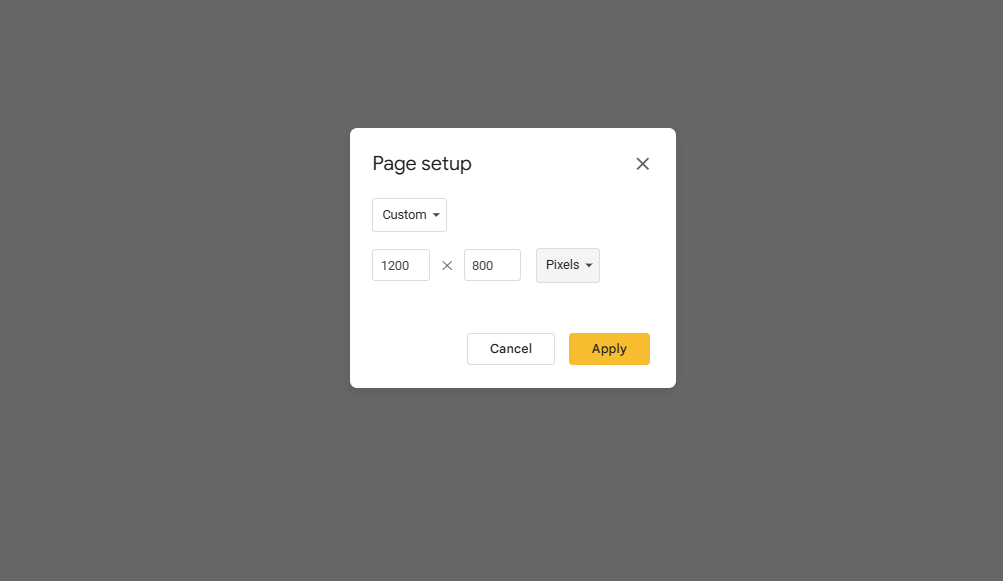
Open a new Google slide and insert the dashboard image from your folder. Under File > Page Setup, choose the custom setting and adjust the sizing to match the dimensions of your dashboard.
Note: This step assumes you dashboard has a fixed layout size. If it’s not fixed, an overlay size of 1500px x 900px is recommended.
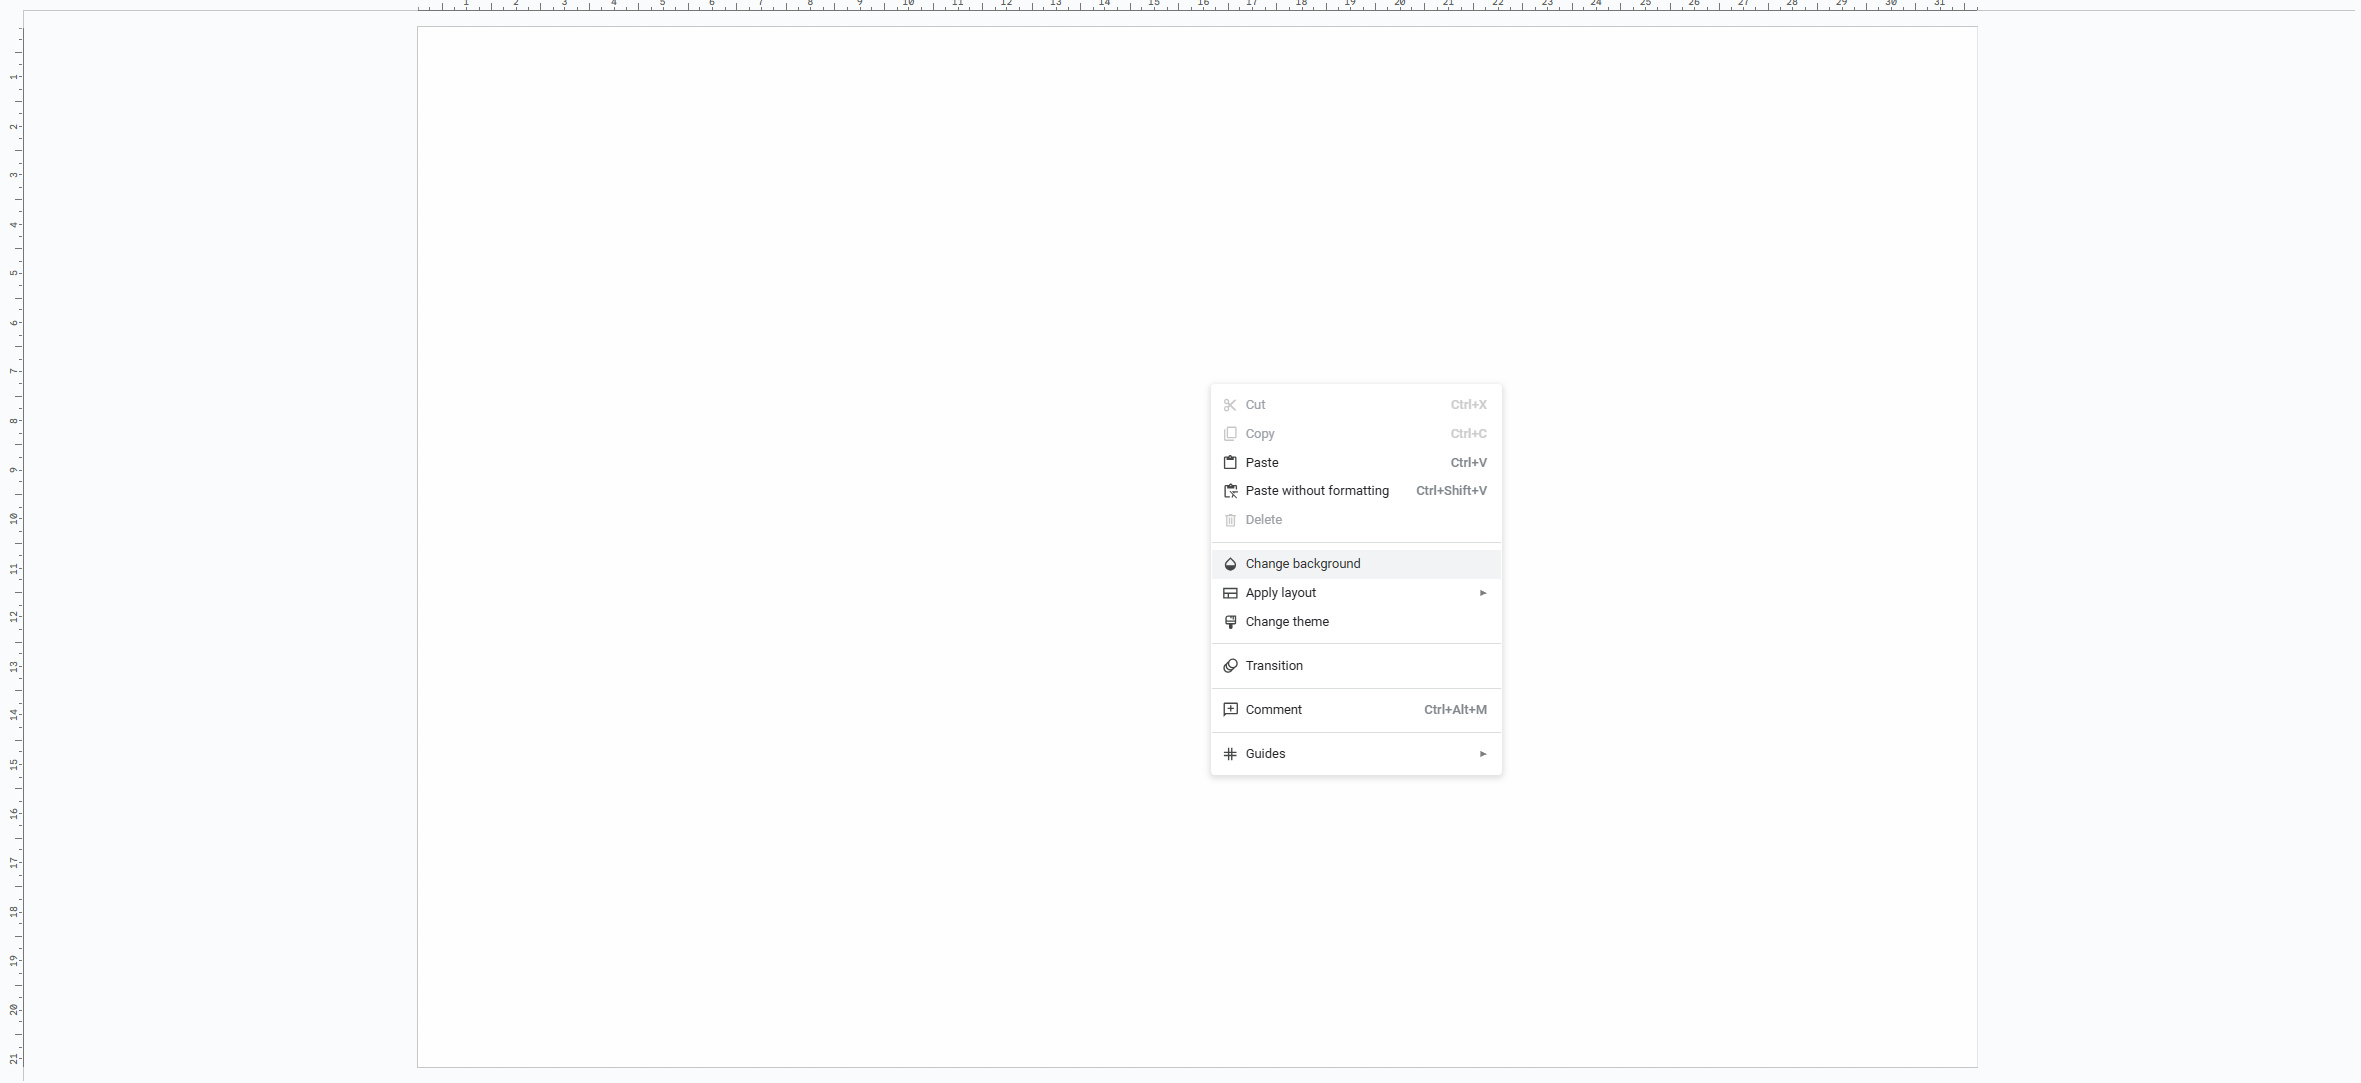
Right click the slide and change the background.
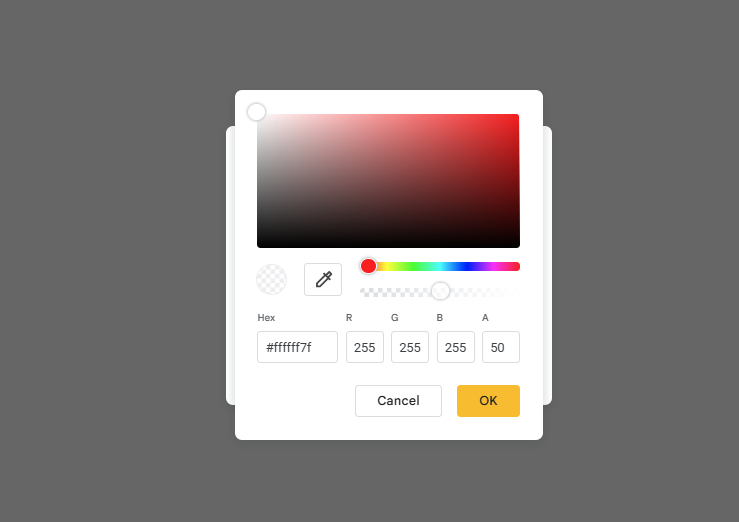
In the pop up window, choose add custom colour. Make the colour white and ensure the value under 'A' is around 50, then press OK (this will make the slide somewhat transparent, allowing users to see the dashboard underneath the overlay).

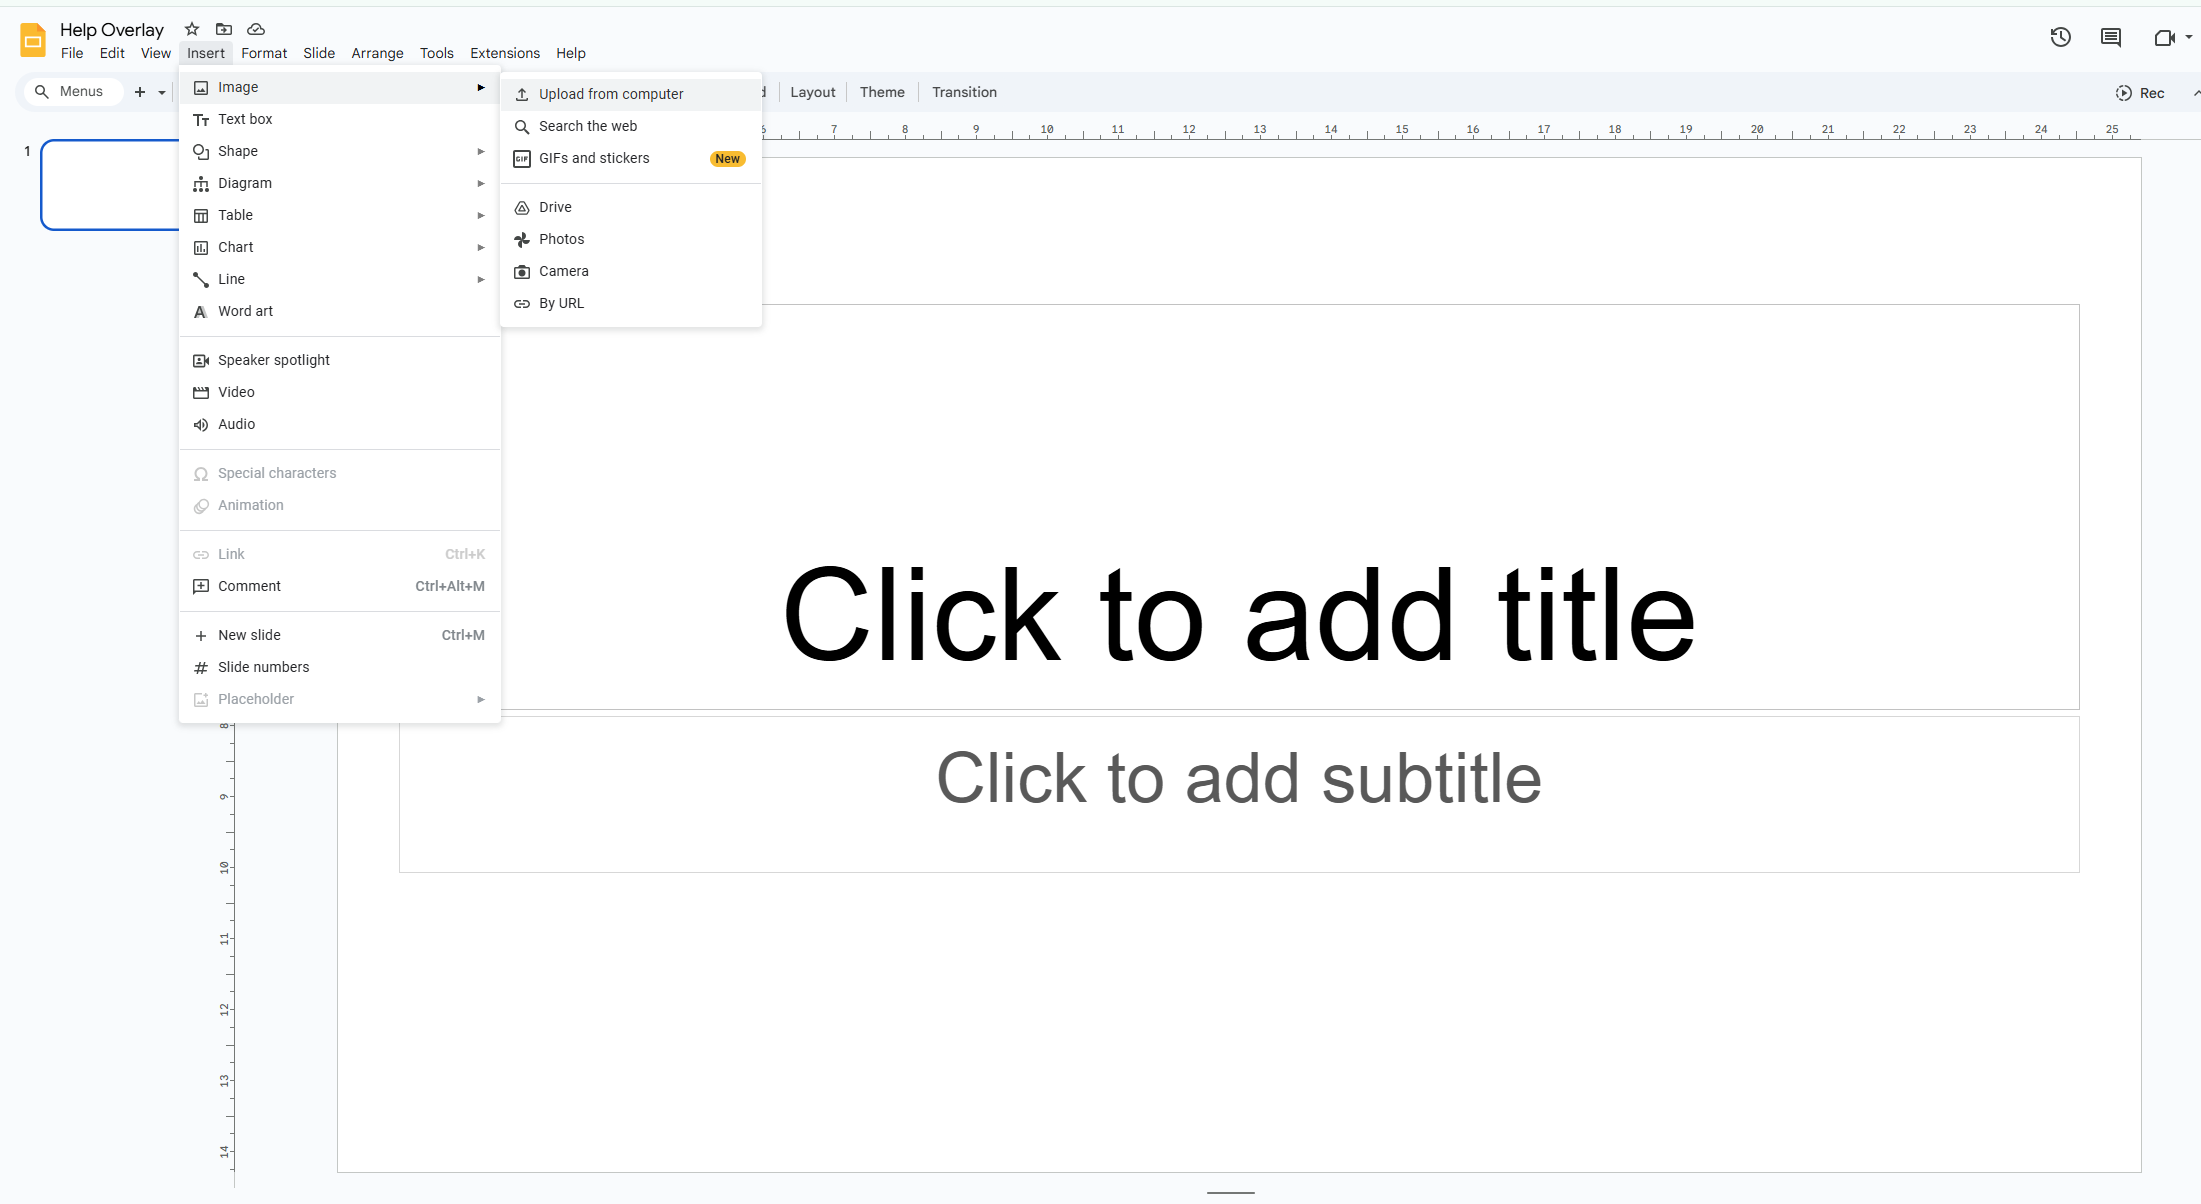
Delete everything in the slide, then add you dashboard image under Insert > Image > Upload from Computer. Then resize the image to match the size of the canvas.
Resize your image to match the size of the dashboard.
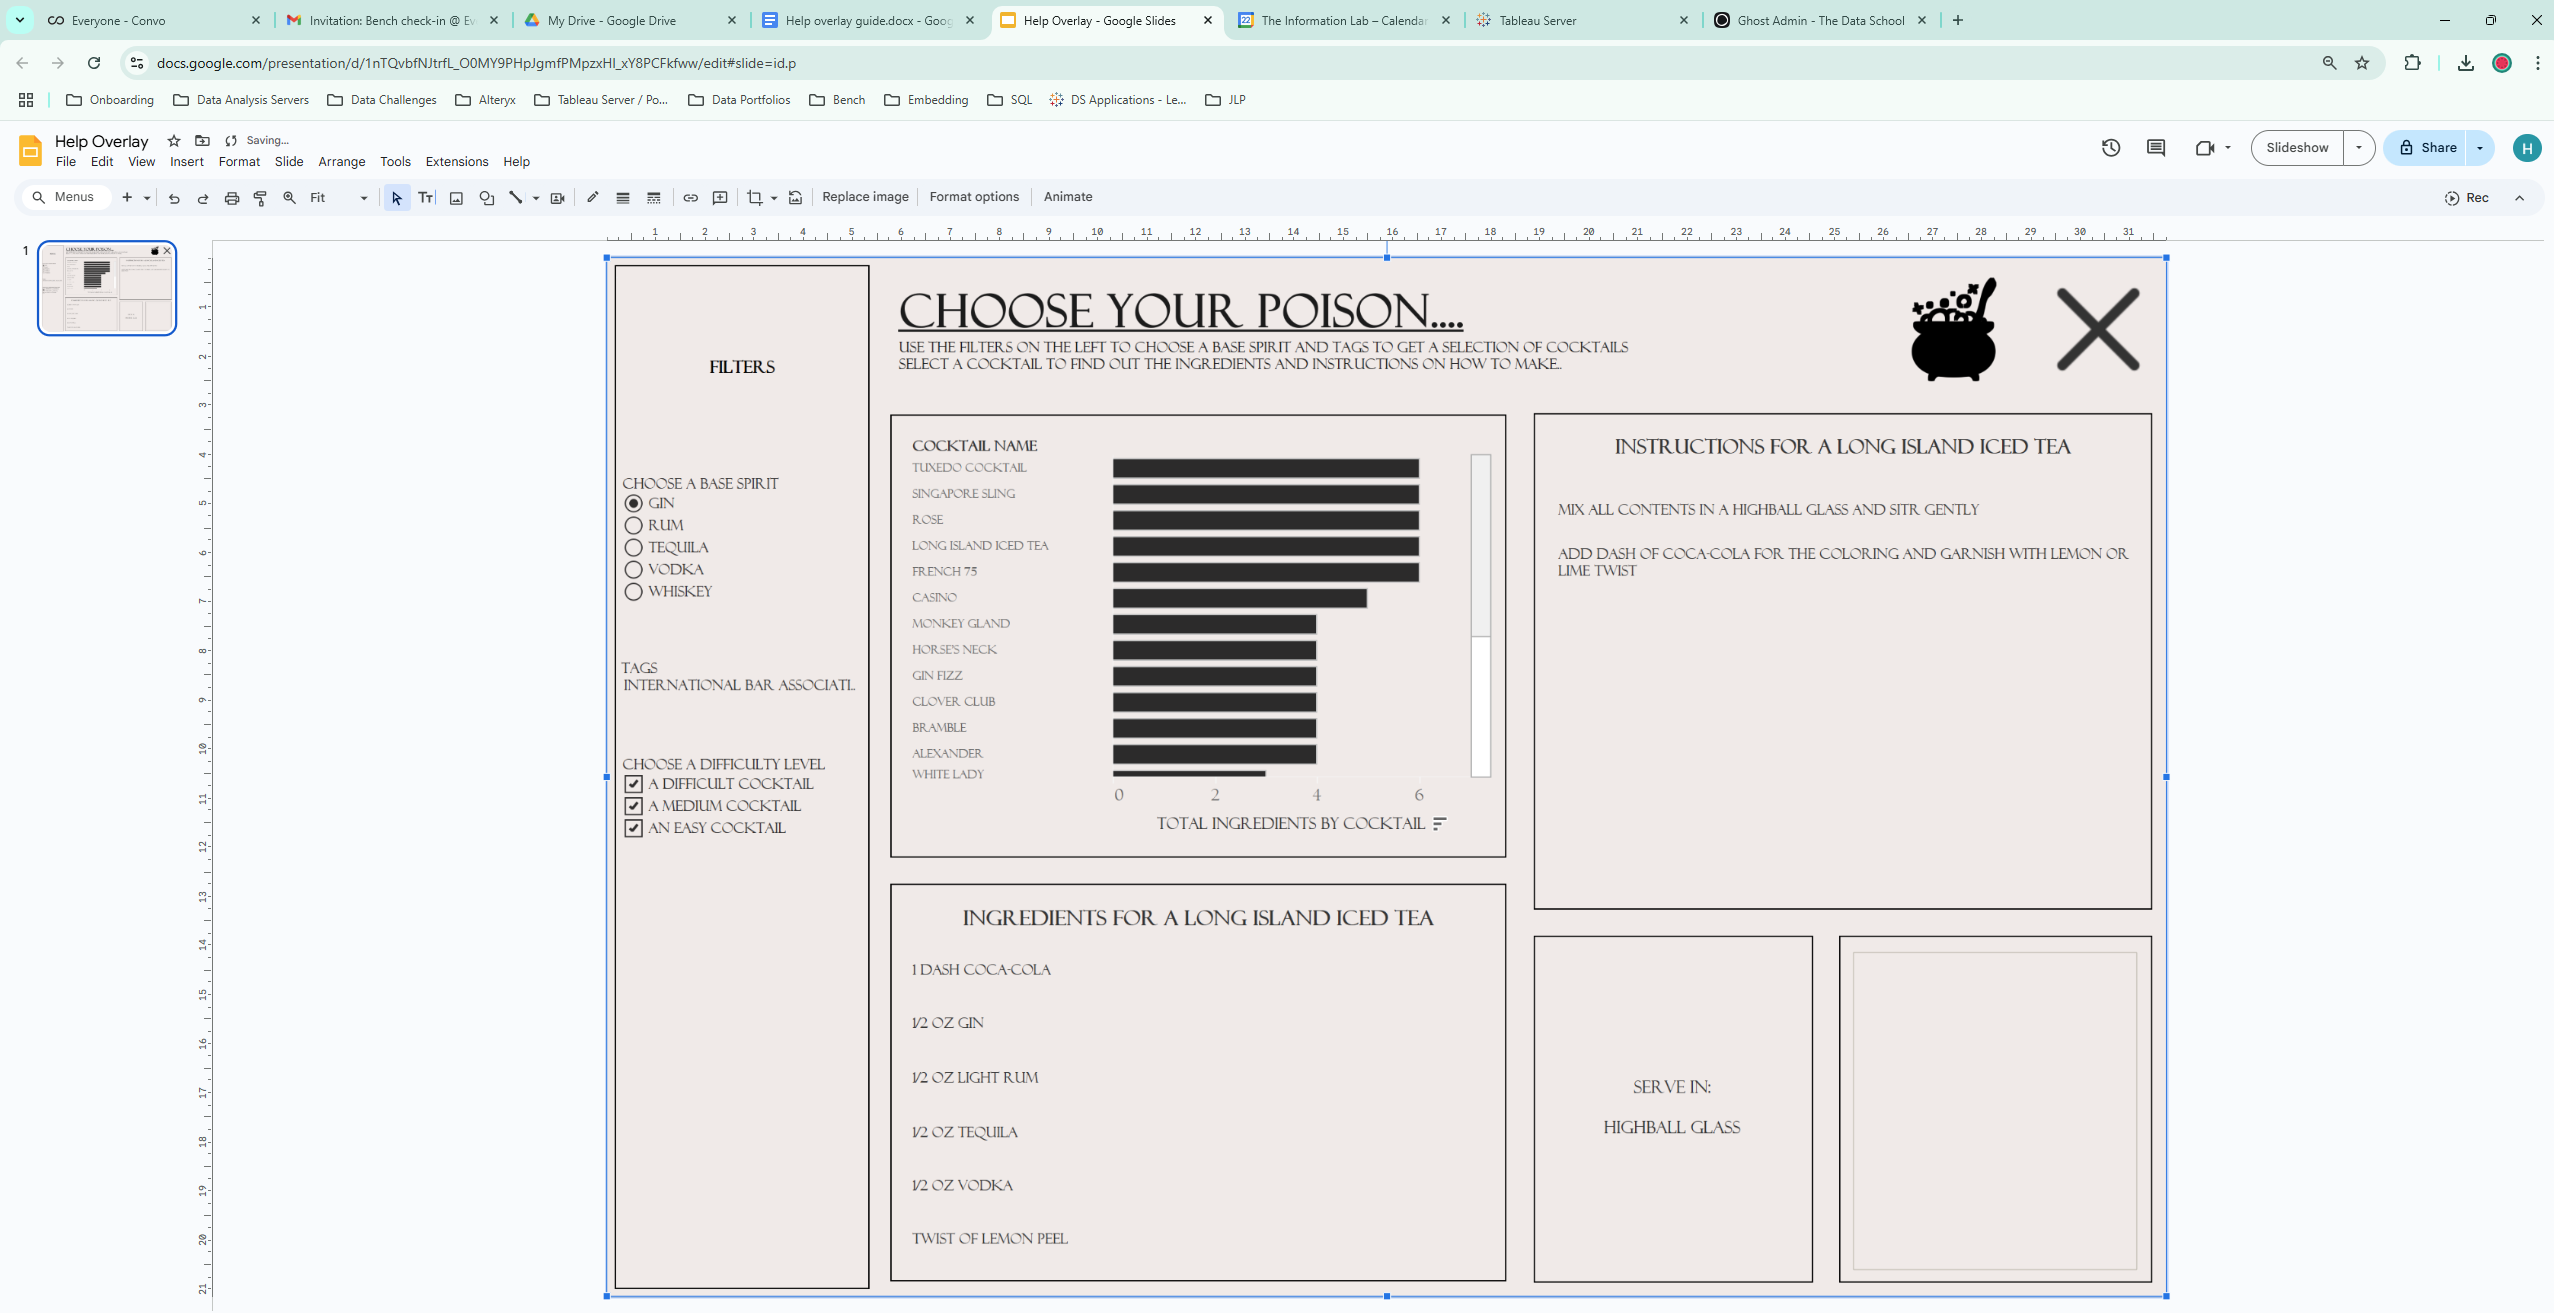
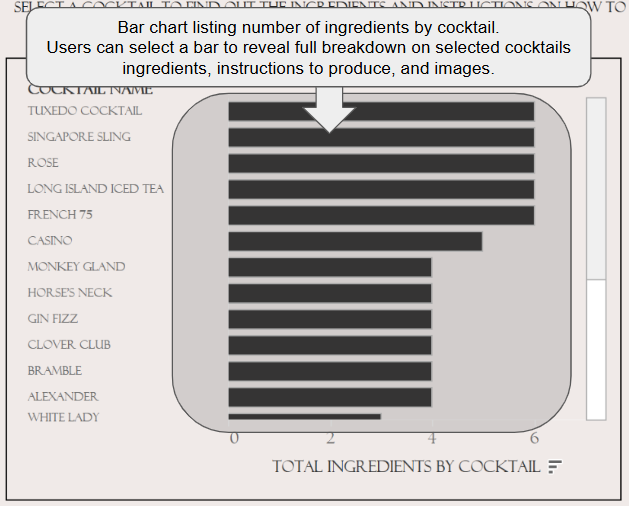
You can then start adding description boxes to the image.
Add rectangle shapes for description boxes and arrows to navigate users around your dashboard.
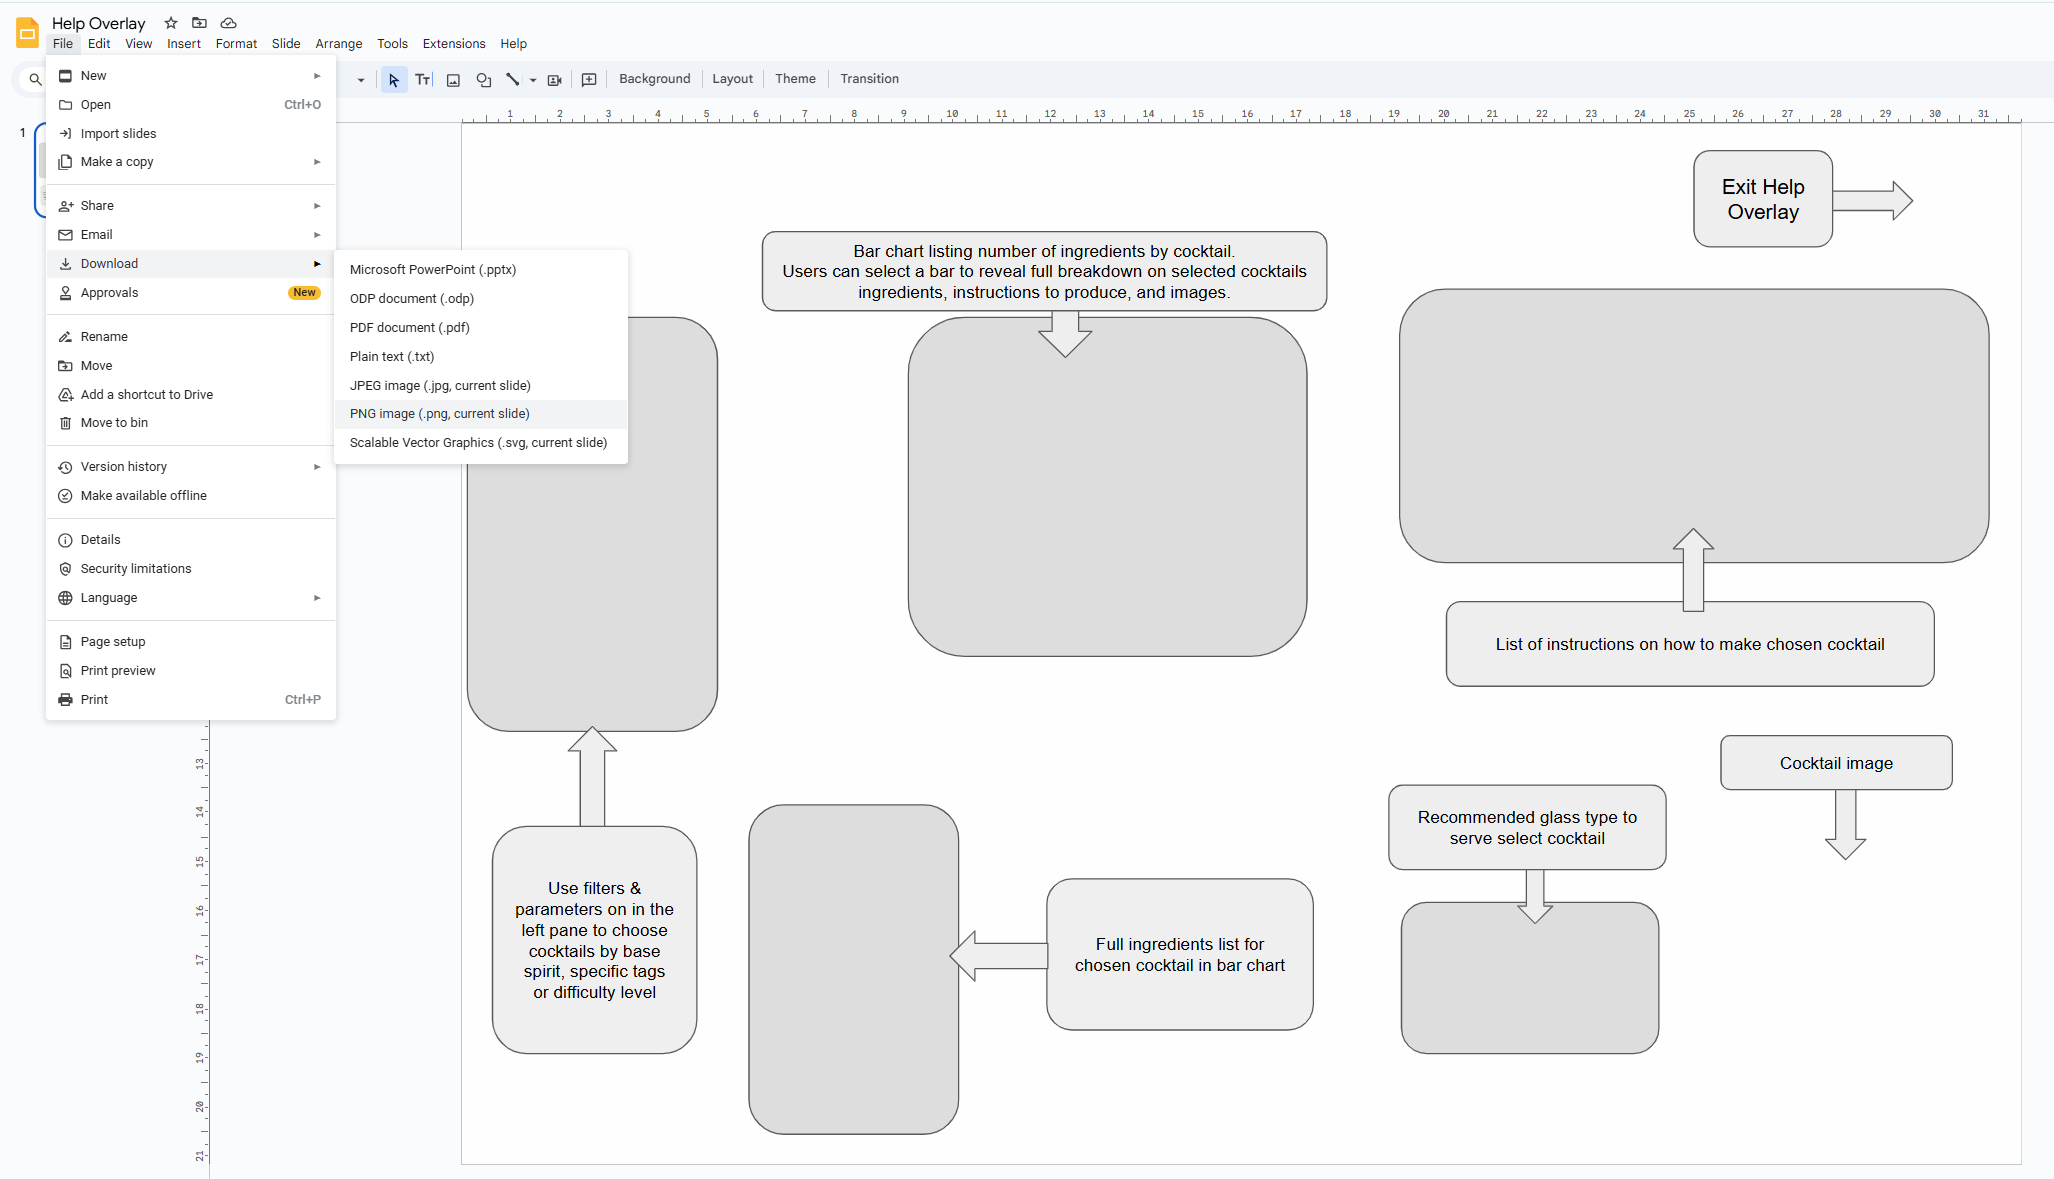
Once you have created all your description boxes and arrows, right click the dashboard image and delete it. Save you overlay as a PNG image by going to File > Download > PNG Image.
Add the overlay to your dashboard
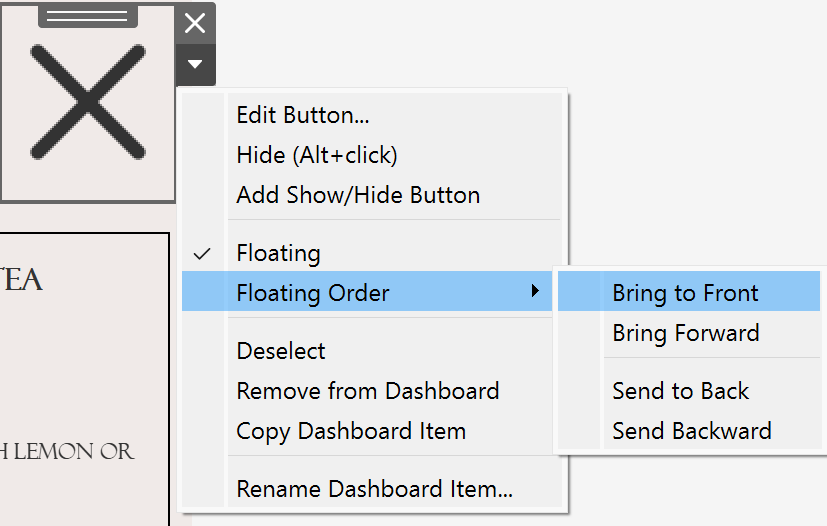
Go back to your tableau workbook ensure your show / hide button is floating and change the floating order of this to 'Bring To Front'.
Go to your image and resize to match the dashboard size and position. Then Edit the image, select 'Choose' and replace the placeholder image with the overlay Google Slide PNG image.
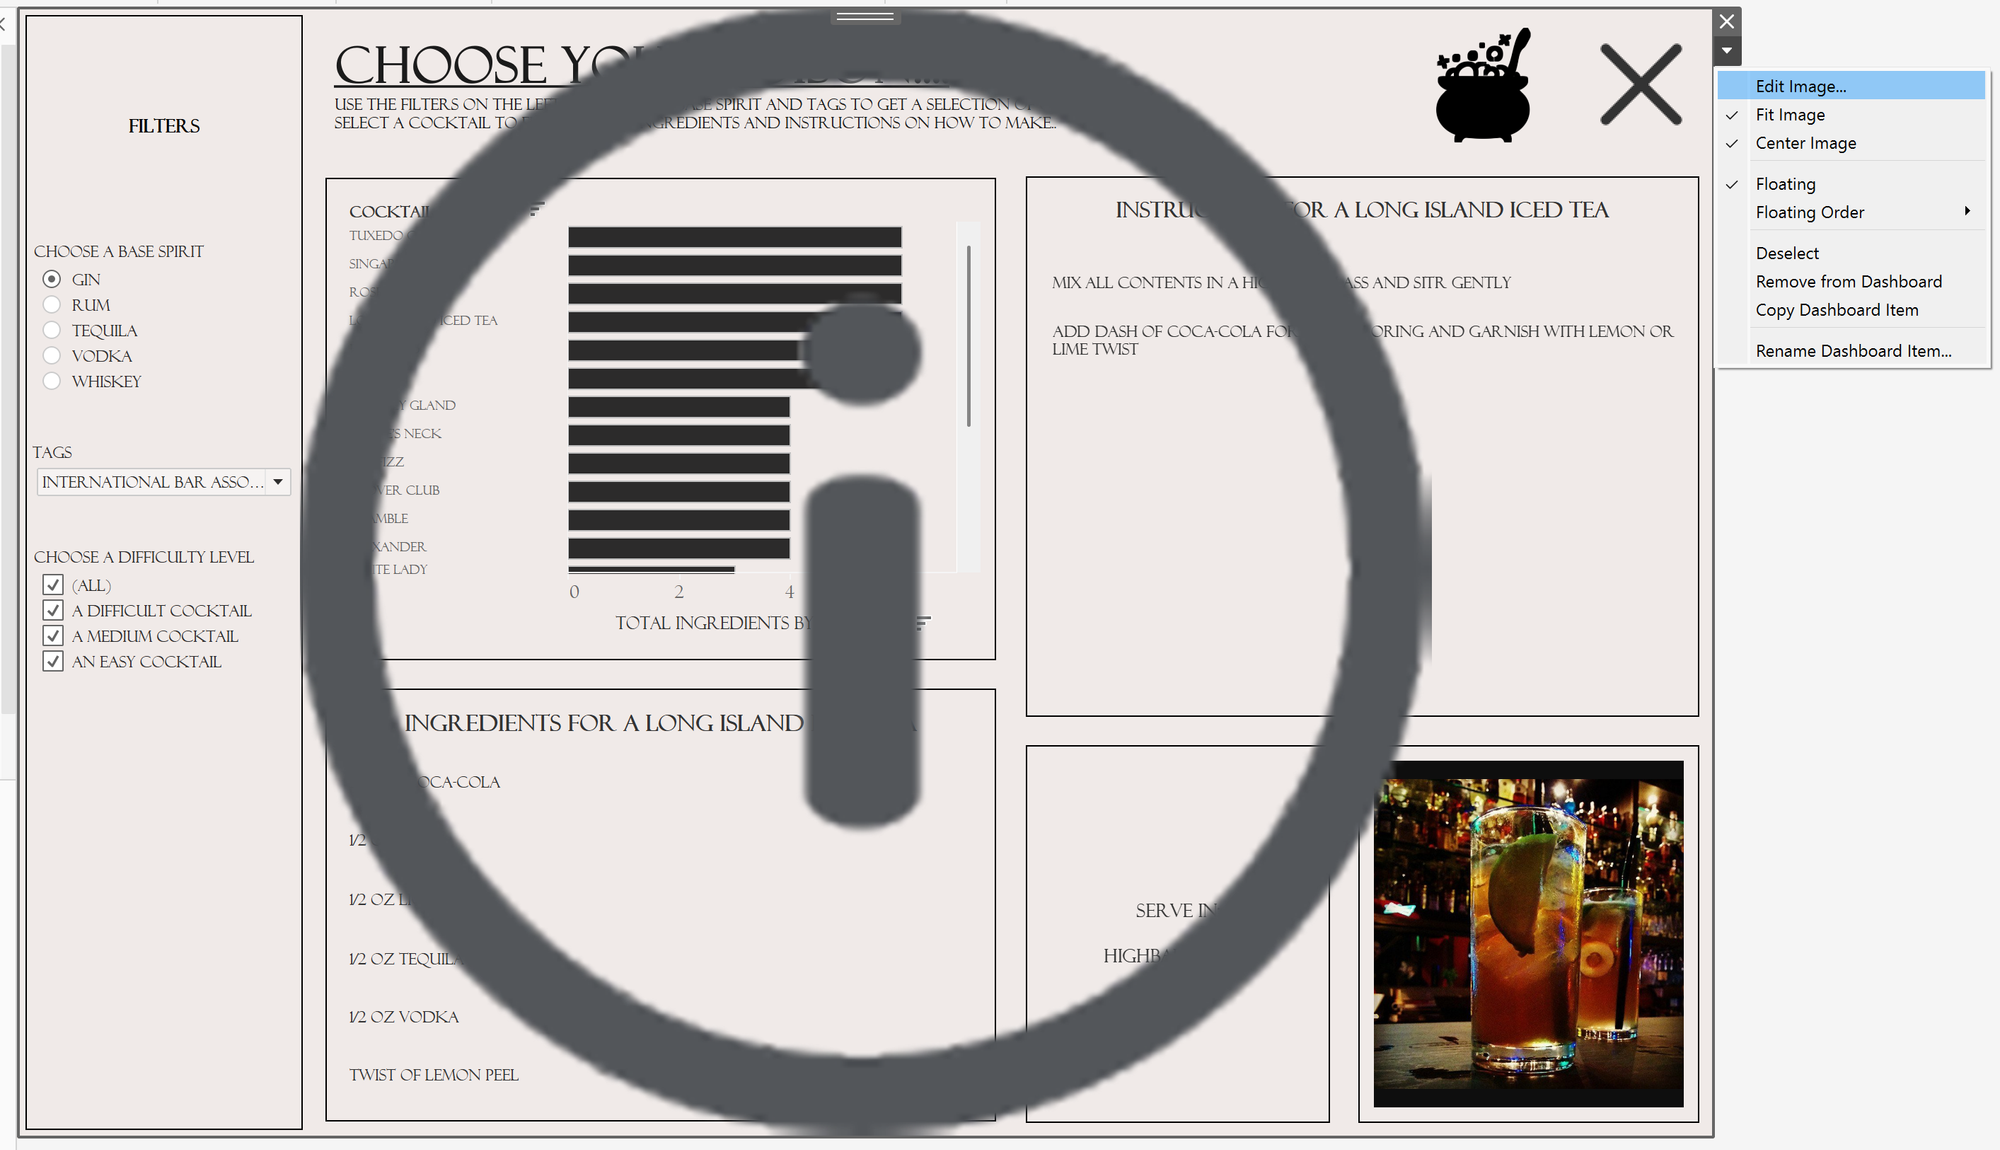
The image will overlay your dashboard and help users to navigate the dashboard. As you moved the show / hide button to the front, this will allow users to close and reopen the Help overlay layer.
Lastly, you can close the help overlay layer and edit the show / hide button to replace the item hidden image to one of your own choosing.
If you need to make changes to the overlay, after you have made the alterations, simply save the new version under the same name and same location. The image is already inserted into the dashboard so will automatically update itself.
Adding a help overlay using Google Sheets and Tableau is an effective way to enhance the user experience of your dashboards. It provides a flexible and dynamic solution for delivering instructions, ensuring that your audience can navigate and interpret the data with confidence. By following these steps, you can create a professional and user-friendly help system that evolves with your dashboard needs.
