The Brief
Today’s challenge was to build an Alteryx Analytic App that used either the Wikimedia or Historical Weather API. The app needed to accept user inputs, retrieve data for the selected period, send it to an LLM through Alteryx’s AI Prompt tool, and output an HTML trend report.
The Plan
As I had less build time available today, my priority was to create a simple, reliable end-to-end workflow before adding anything more ambitious.
I chose the Historical Weather API and allowed users to:
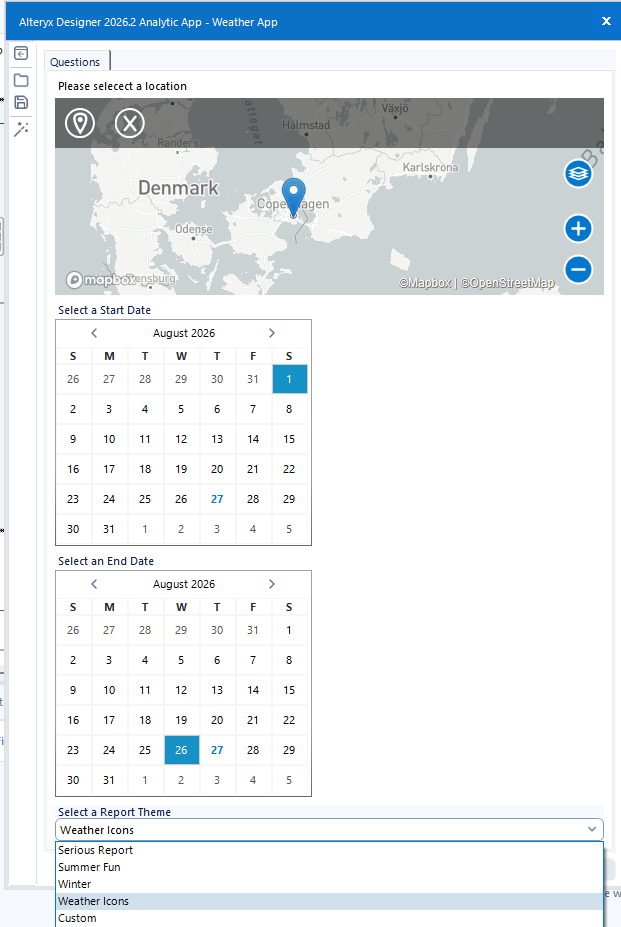
- Select and label a location on a map
- Choose a start and end date
- Select a visual report theme
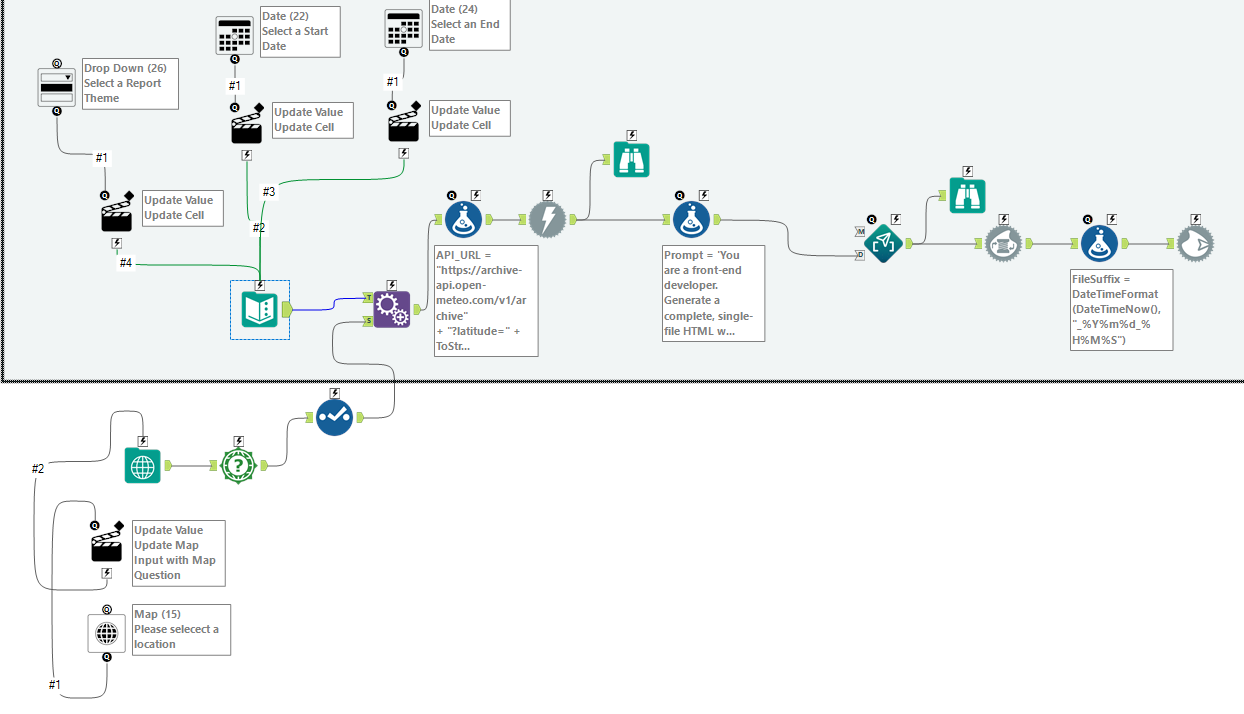
The app converts the selected point into latitude and longitude, builds the API request, downloads the daily weather data and passes it to Gemini 2.5 Flash as one structured CSV input.
Building the App
The first major milestone was producing a functioning HTML file from the LLM response. The HTML is converted into a Blob, saved with a timestamped filename and opened in the browser.
Once the core workflow worked, I added a more user-friendly map input, dynamic location labels and theme selection.
Prompt Engineering
The largest part of the project became prompt engineering.
Early prompts produced reasonable analysis, but the HTML was sometimes incomplete, unstyled or missing working charts. I progressively made the prompt more specific by defining:
- The required HTML structure and closing tags
- Page layout and KPI hierarchy
- Exact chart types, axes, legends and colours
- Period-aware daily, weekly, monthly and annual aggregation
- Rules preventing unsupported claims or invented data
- Theme-specific art direction
- Output-token priorities and fallback instructions
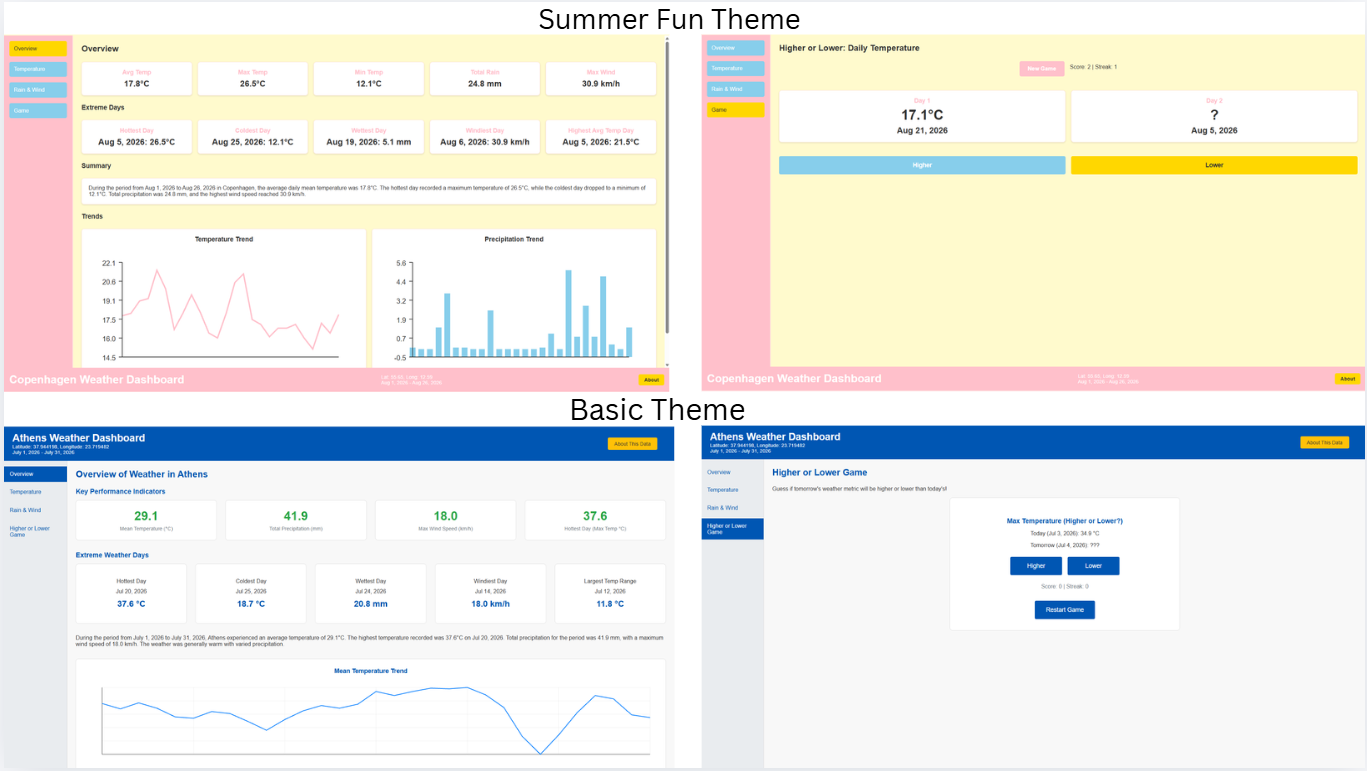
The report also includes an interactive Higher or Lower weather game generated from the selected daily observations.
The Final Result
The finished app generates a themed, interactive weather dashboard containing summary KPIs, insights, trends, notable days and a game—all within a self-contained HTML file.