


When reshaping data, you will often need to convert columns into rows or rows into columns.
The names used for this process vary between tools:
- In Tableau Prep, you might see Pivot Columns to Rows and Pivot Rows to Columns.
- In Power Query, these operations are called Unpivot and Pivot.
- In Alteryx, the equivalent tools are called Transpose and Cross Tab.
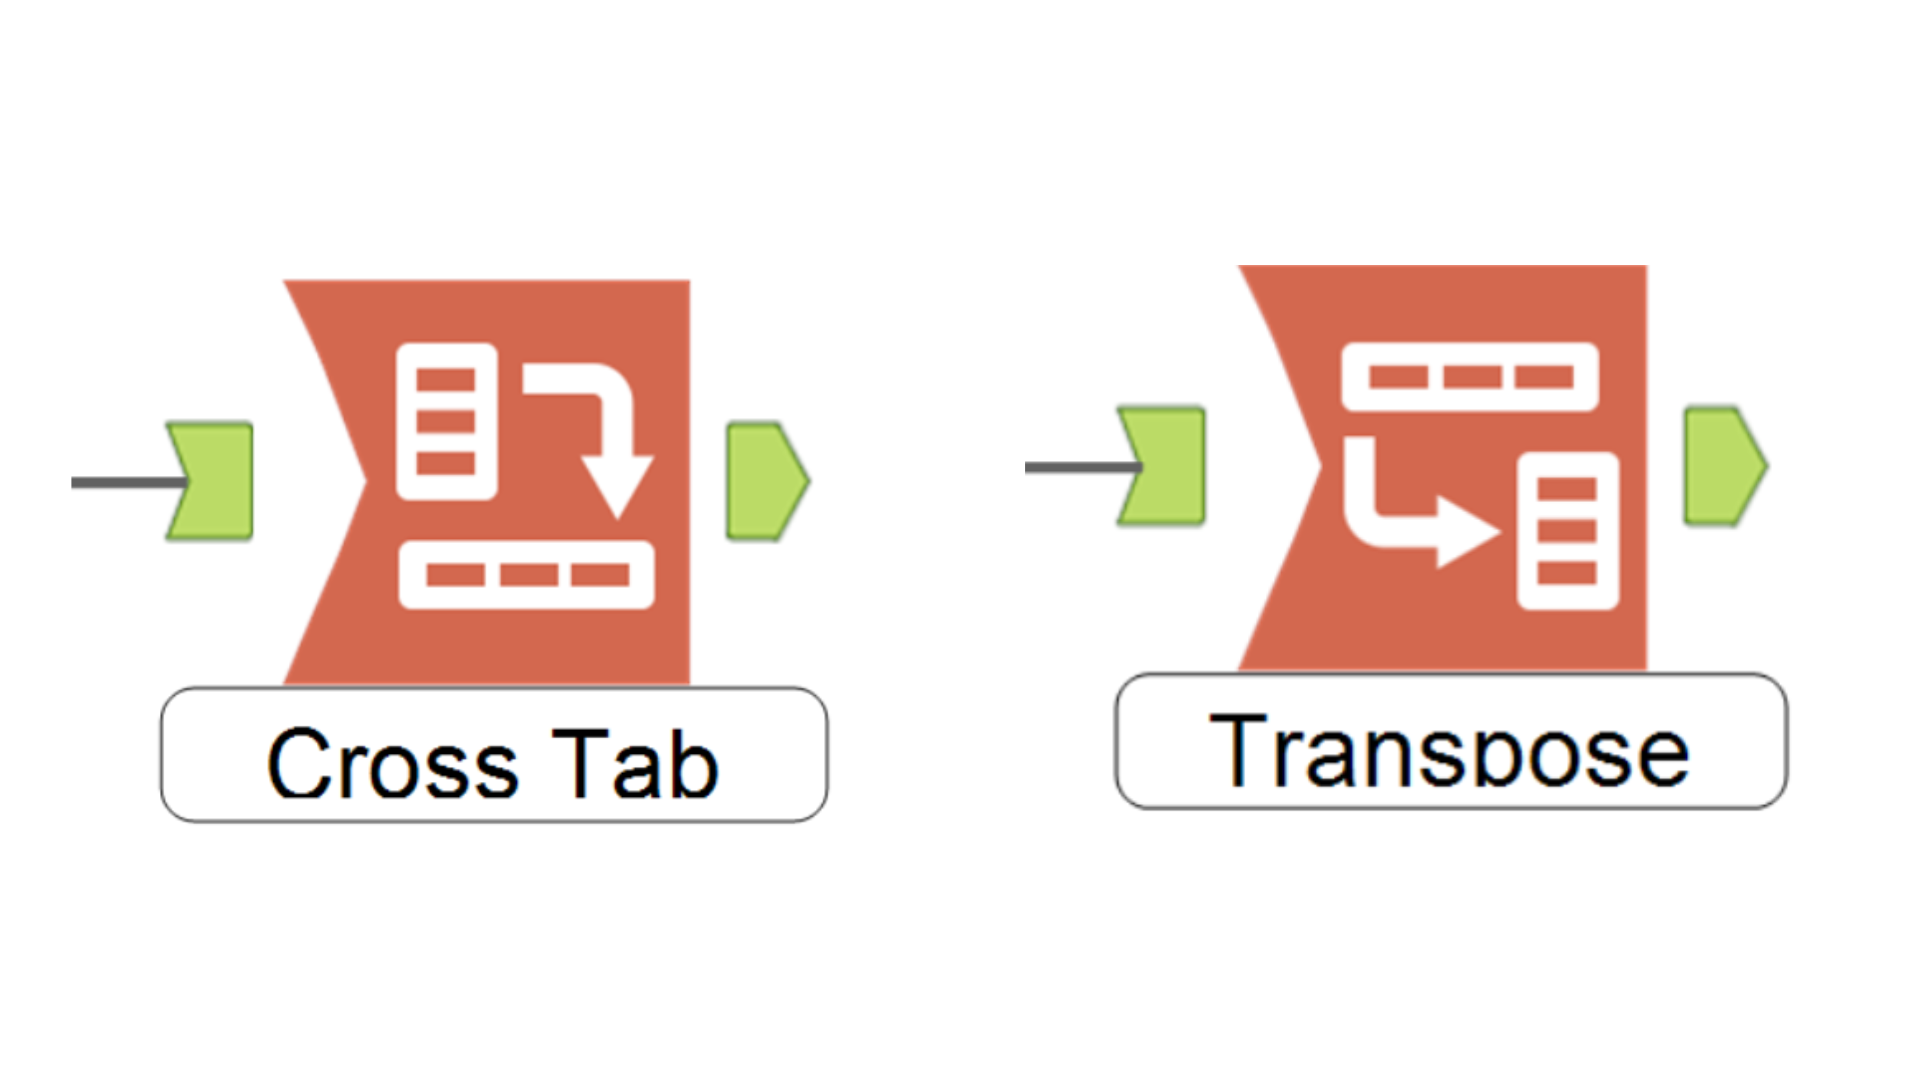
Fortunately, the Alteryx tool icons give you a helpful visual clue:
- Transpose converts columns into rows.
- Cross Tab converts rows into columns.
Transpose: Converting Columns into Rows
The Transpose tool takes a wide table containing several columns and converts it into a longer, narrower table.
For example, a table containing separate columns for January, February and March could be transposed so that the month names appear in one column and their corresponding figures appear in another.
To configure the Transpose tool, fields are divided into two groups:
1) Key Columns
Key Columns remain unchanged and are repeated for each newly created row.
These are normally the fields that identify the record, such as:
- Customer ID
- Product
- Region
- Date
2) Data Columns
Data Columns are the fields you want to transpose from columns into rows.
After transposing the data, Alteryx creates two new fields:
- Name, containing the original column name.
- Value, containing the value that was stored in that column.
For example, this data:
| Customer | January | February | March |
|---|---|---|---|
| Customer A | 10 | 15 | 12 |
Would become:
| Customer | Name | Value |
|---|---|---|
| Customer A | January | 10 |
| Customer A | February | 15 |
| Customer A | March | 12 |
The selected Key Column remains in the data, while each selected Data Column creates a new row.
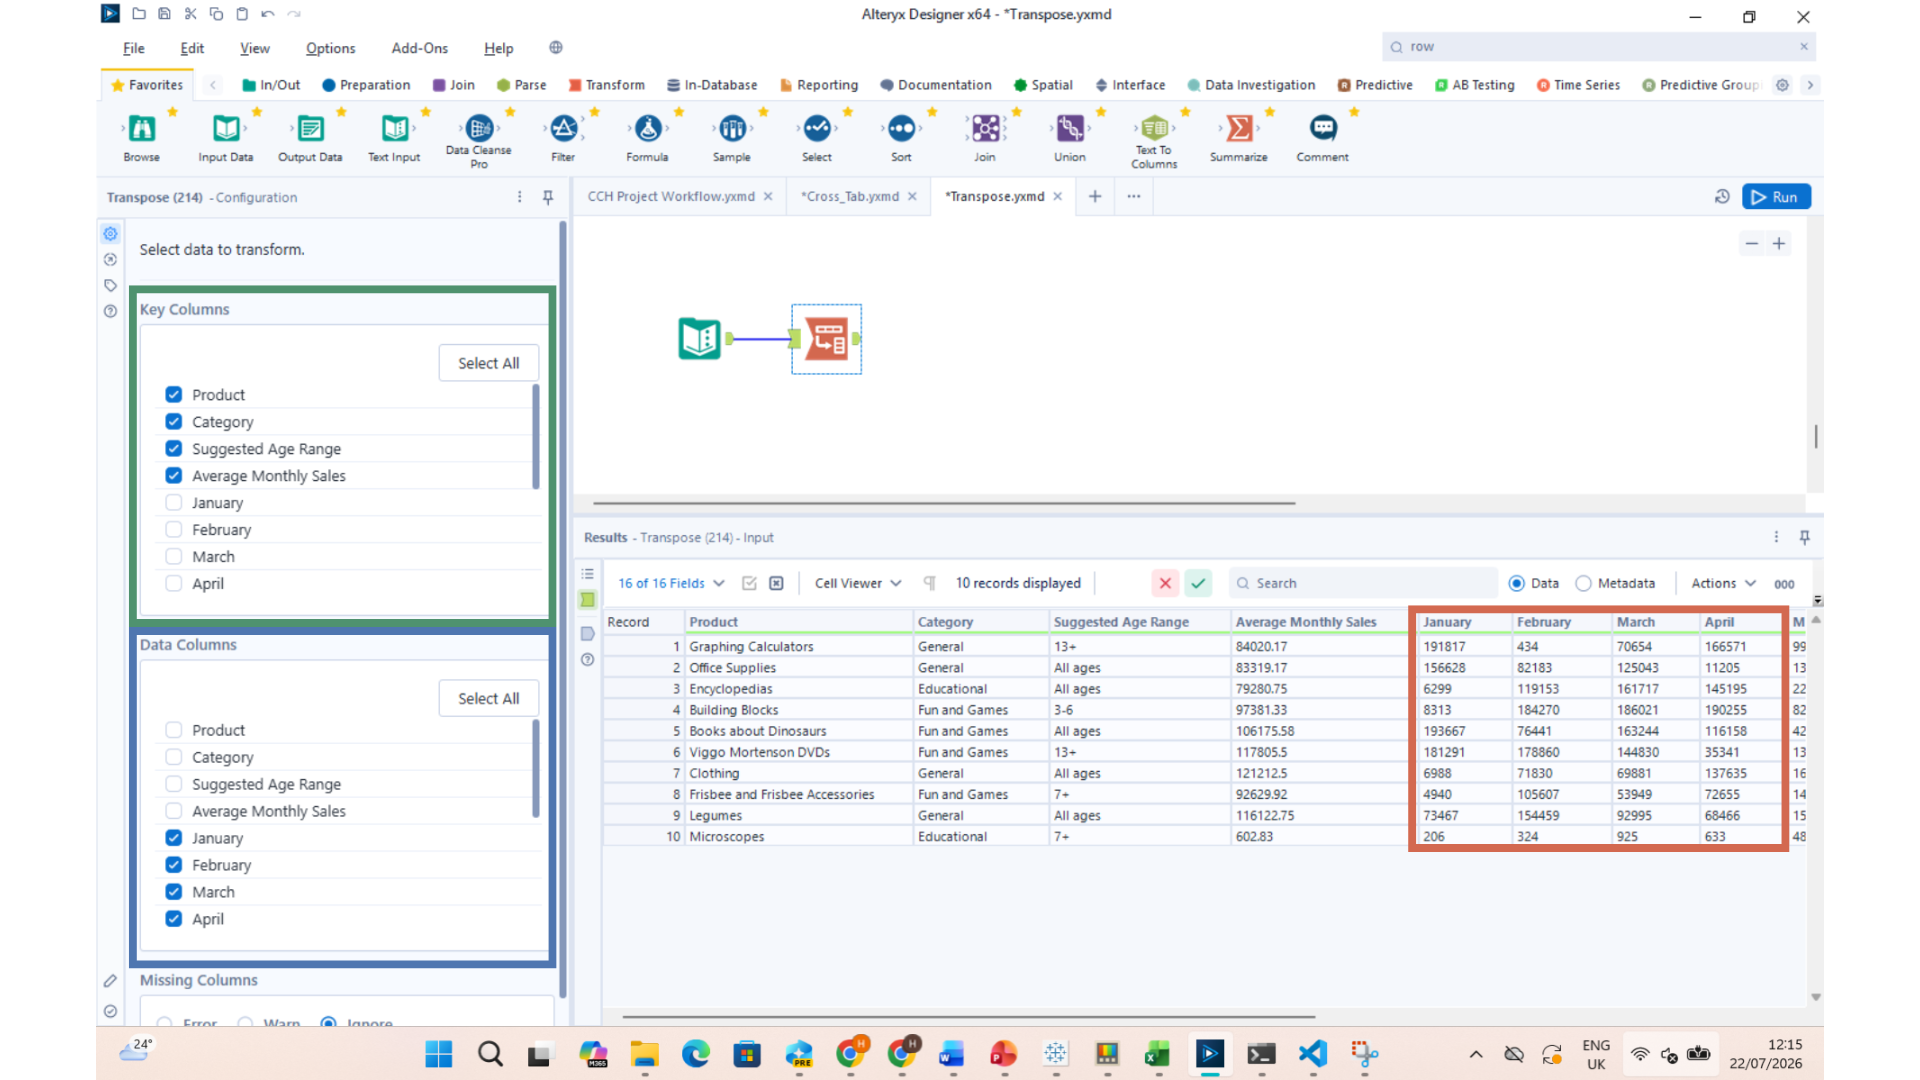
For example, this image shows some data before the Transpose tool, and the way the tool is set up:
And this image shows the result of the transformation:
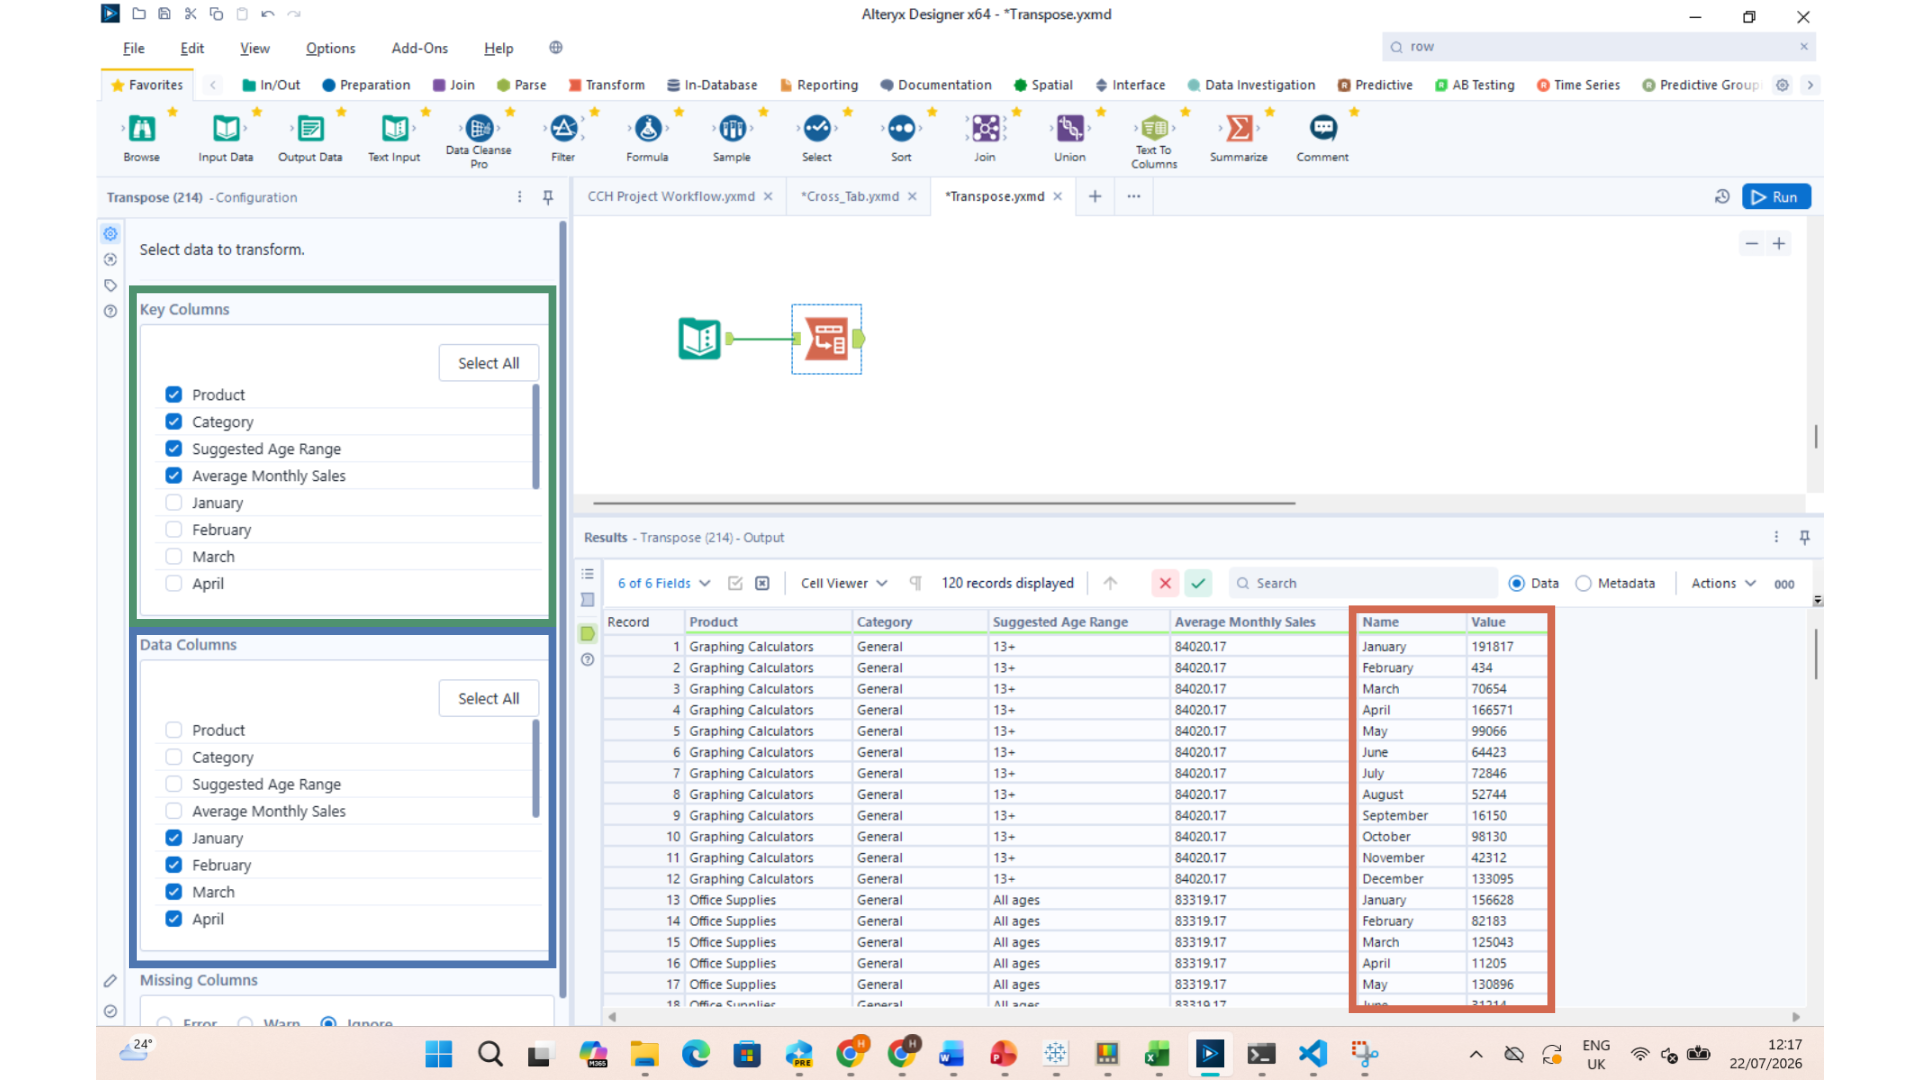
After the Transpose tool, the Key Columns remain unchanged and are repeated for each new row. The selected monthly columns have been converted from separate fields into two columns: Name, which contains the original month, and Value, which contains the corresponding sales figure.
Cross Tab: Converting Rows into Columns
The Cross Tab tool performs the opposite operation to Transpose. It takes values currently stored vertically in rows and turns them into new columns.
For example, imagine you have sales data with one row per product category and month:
| Region | Month | Category | Sales |
|---|---|---|---|
| North | January | Furniture | 500 |
| North | January | Technology | 300 |
| North | February | Furniture | 450 |
| North | February | Technology | 400 |
You could use the Cross Tab tool to turn each month into a separate column:
| Region | Category | January | February |
|---|---|---|---|
| North | Furniture | 500 | 450 |
| North | Technology | 300 | 400 |
The Cross Tab configuration contains four main settings.
1) Group Data by These Values
The Group By fields determine what each row in the final output represents.
In this example, selecting Region and Category would create one row for each region and product-category combination.
This section is optional. If no Group By fields are selected, Alteryx will summarise the entire dataset into a single row.
2) Change Column Headers
This is the field containing the values that should become the new column names.
In this example, Month would be selected so that January and February become separate columns.
3) Values for New Columns
This is the field containing the values that should be placed inside the newly created columns.
Here, this would be the Sales field.
4) Method for Aggregating Values
Alteryx also requires you to choose an aggregation method because there may be more than one record for the same combination of Group By fields and new column header.
The correct method depends on what the data represents.
Sum
Use Sum when multiple records should be added together.
For example, there may be several individual Furniture sales in the North region during January:
| Region | Month | Category | Sales |
|---|---|---|---|
| North | January | Furniture | 200 |
| North | January | Furniture | 300 |
Using Sum would return a January Furniture sales value of 500.
First or Last
Use First or Last when there should only be one value for each combination and you want to return that value as it is.
For example:
| Employee | Attribute | Value |
|---|---|---|
| Employee A | Department | Finance |
| Employee A | Manager | Sarah |
You could Cross Tab the Attribute field to create separate Department and Manager columns. As there should only be one value for each attribute, selecting First would return the existing value without changing it.
However, First does not check that the value is unique. If duplicate records exist, it will simply keep the first one it encounters, so it is worth checking the data beforehand.
Concatenate
Use Concatenate when several text values belong to the same output cell and you want to retain all of them.
For example:
| Project | Attribute | Value |
|---|---|---|
| Project A | Team Member | Harry |
| Project A | Team Member | Alex |
| Project A | Team Member | Priya |
If Project is used as the Group By field and Attribute is used for the new column headers, Concatenate could return:
| Project | Team Member |
|---|---|
| Project A | Harry, Alex, Priya |
This is useful for fields such as team members, matching reasons, product names or categories where multiple text values need to be preserved.
Other aggregation options, including Count, Average, Minimum and Maximum, may be appropriate depending on the question being answered.
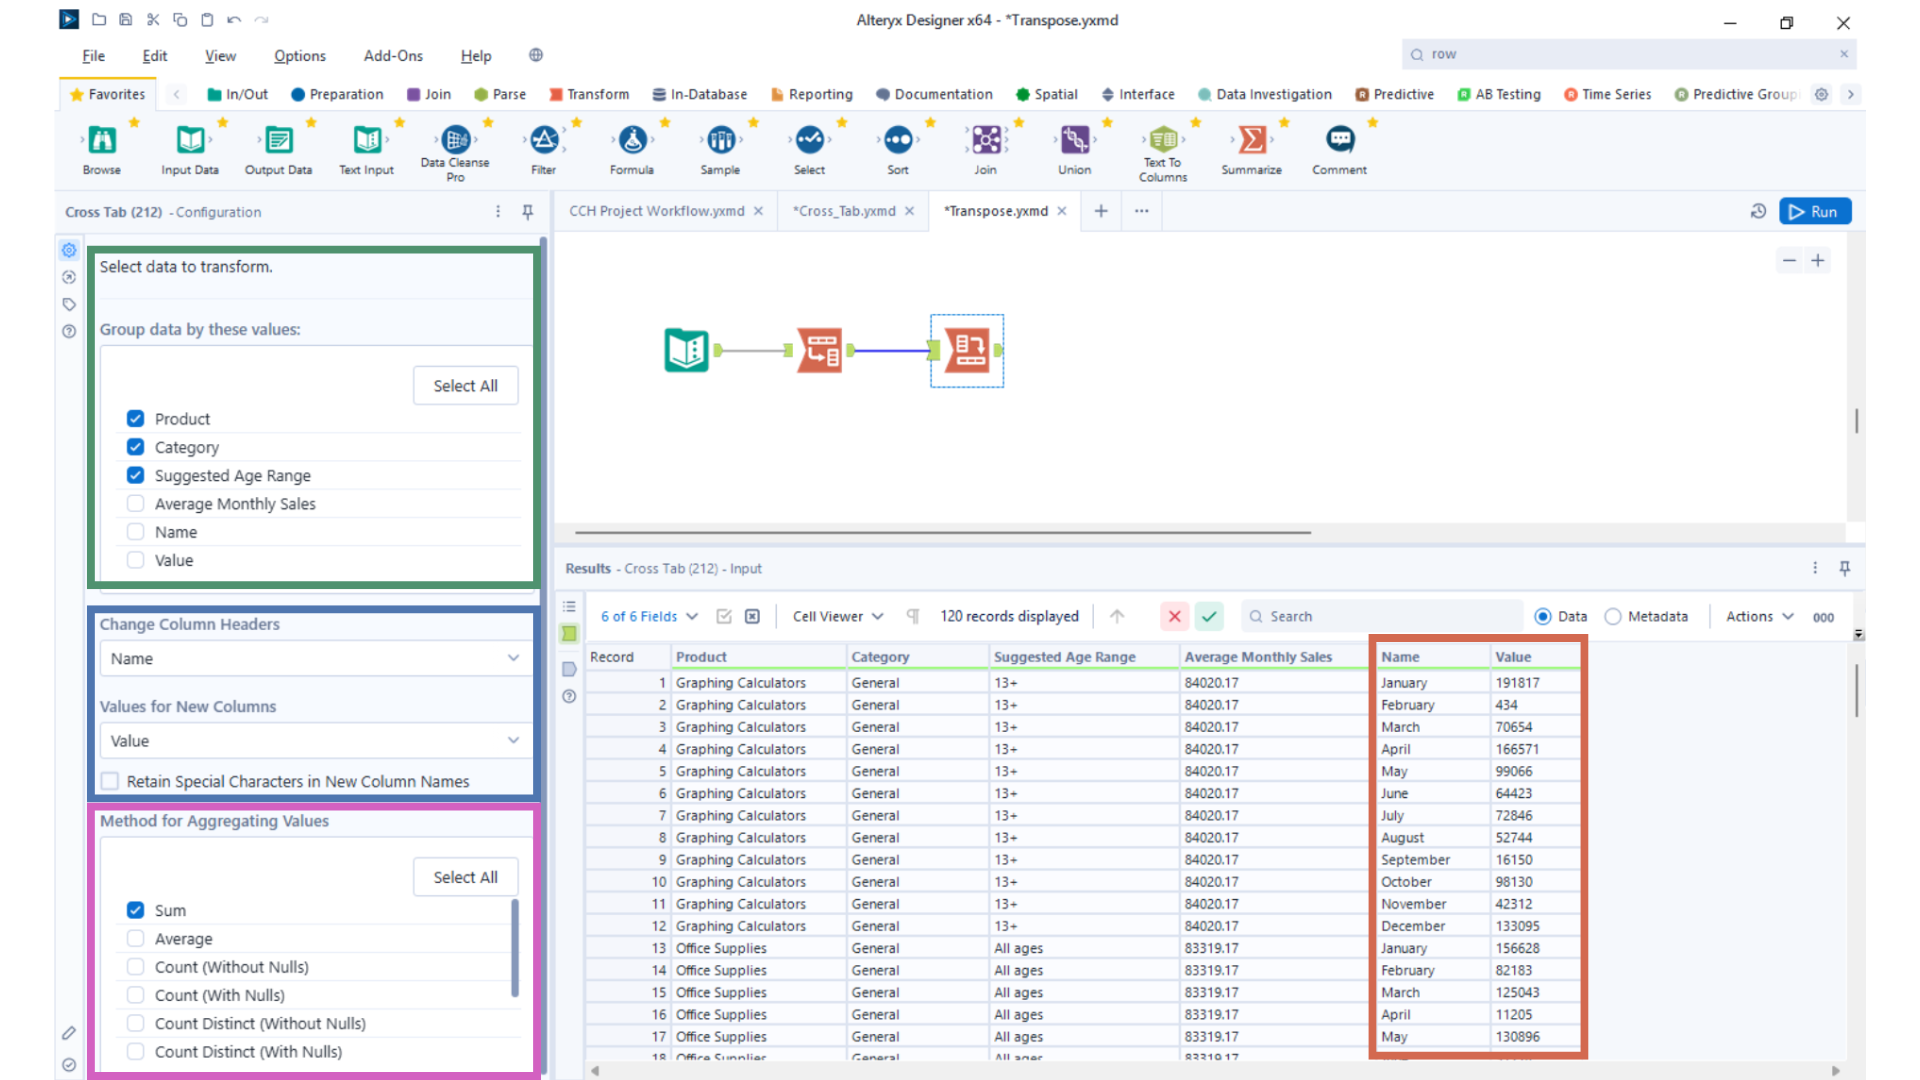
As an example, if we were going to revert the transformation done by the Transpose tool in the earlier example, the Cross Tab setup might look like this:
And the result of the transformation would look like this:
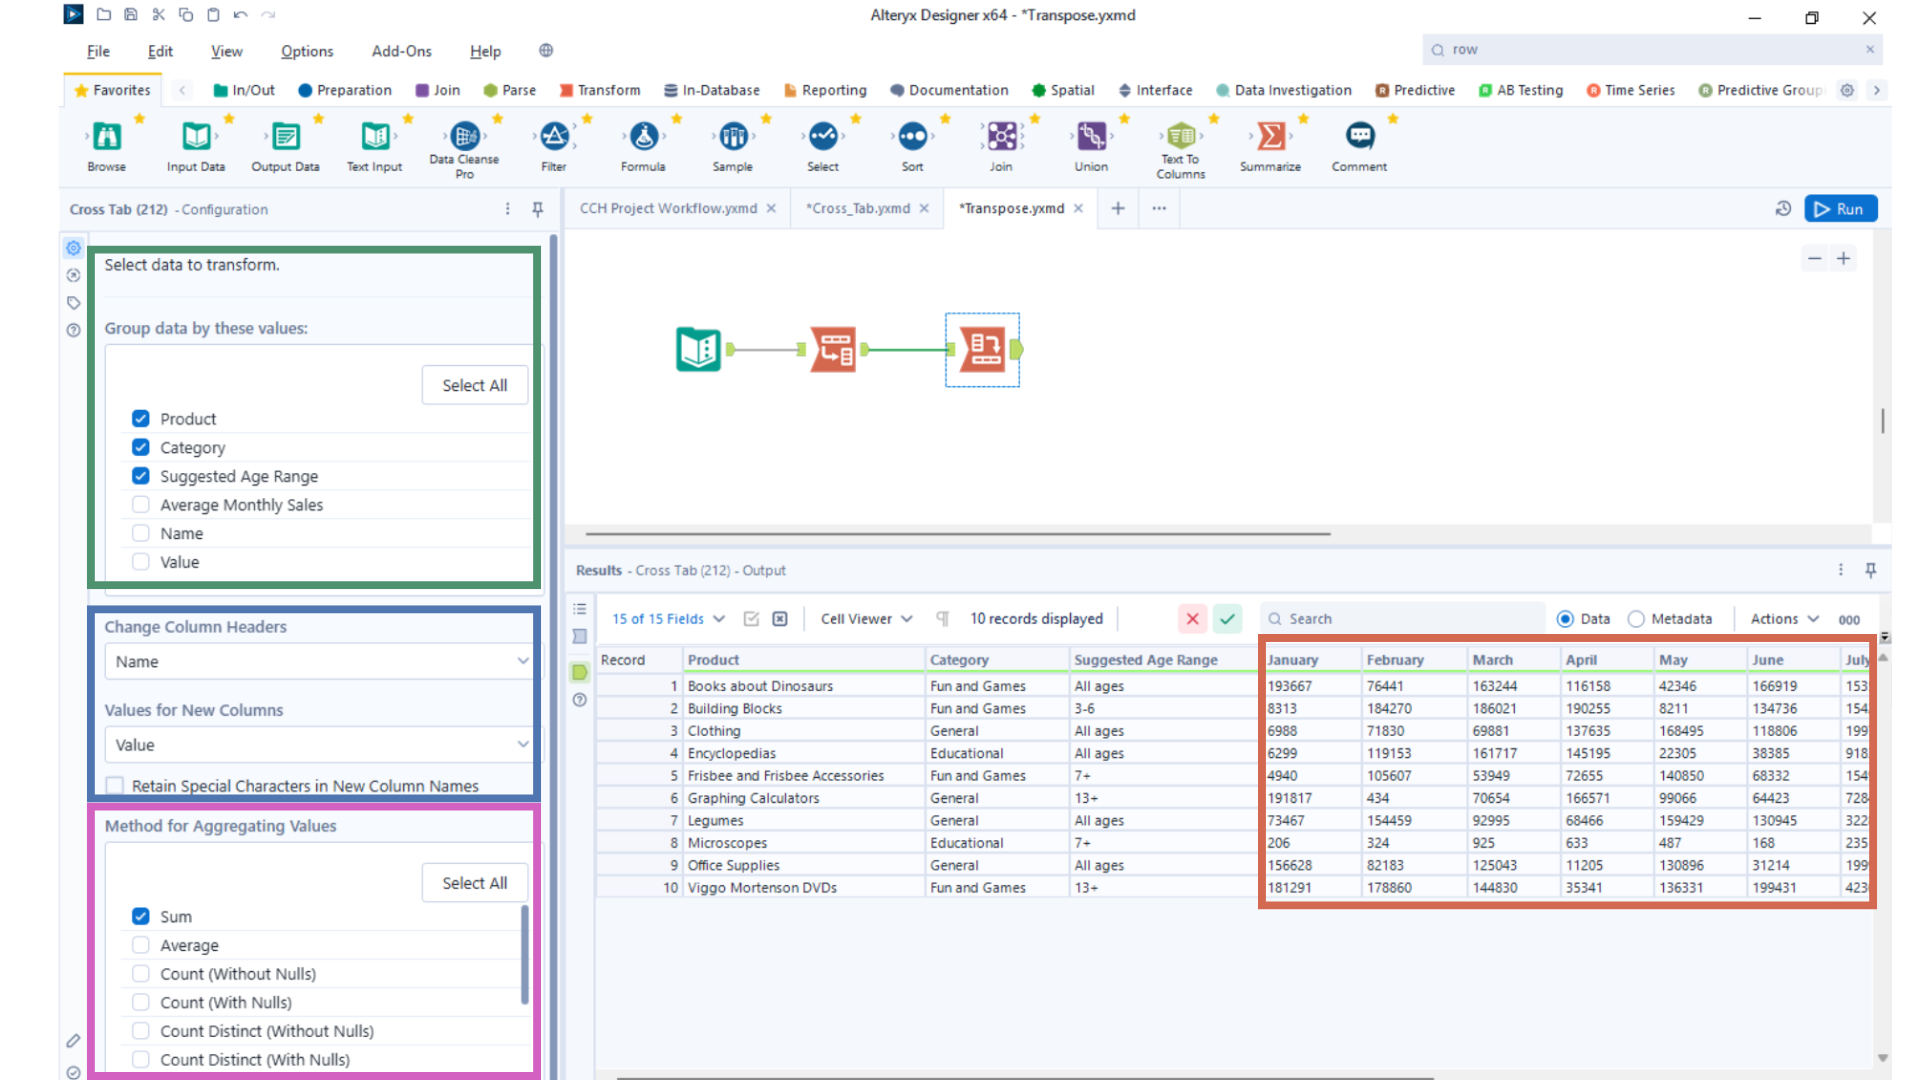
In this setup, Product, Category and Suggested Age Range are selected as the grouping fields, so these remain as identifying columns in the output. The values in the Name field are used to create the new column headers, while the corresponding figures from the Value field populate those columns.
Because Sum is selected as the aggregation method, Alteryx will add together any values that share the same grouping fields and new column header. The result is one row for each unique product, category and age-range combination, with separate columns for January, February, March and the other months—effectively reversing the earlier Transpose transformation.
In Summary
The easiest way to remember the two tools is:
- Transpose makes data taller: columns become rows.
- Cross Tab makes data wider: rows become columns.
Transpose is generally simpler because you only need to decide which fields should stay fixed and which should be converted into rows.
Cross Tab requires slightly more thought because you have to define what each output row represents, which values should become headers and how multiple records should be aggregated.