


In this blog post we will be diving into date tables in Power BI! Date tables are kind of like a calendar, and they're beneficial for time-based analysis, help ensure accurate calculations, and allows you to change the format of your dates.
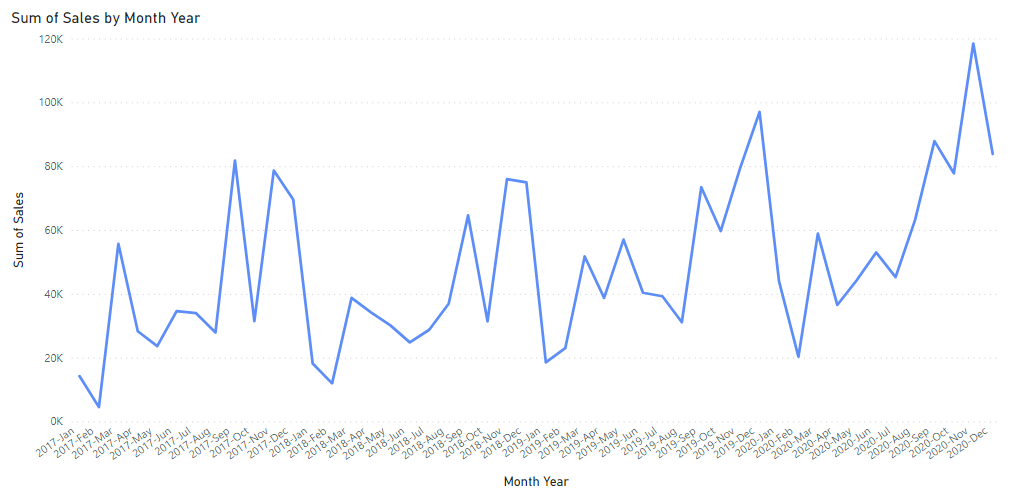
In this blog I'll be using example superstore data which can found in here, and I'll only be using the 'ORDERS' table to create a graph like the one below:
Once the data has open up in Power BI, in 'MODELLING', then ‘ADD TABLE’, we can create a table called ‘_DATE’.

The reason we start the name with an underscore is to send it to the top of the pane on the far right as the tables are listed in alphabetical order, and this is good practice as it helps find the date table faster when there are many other tables.
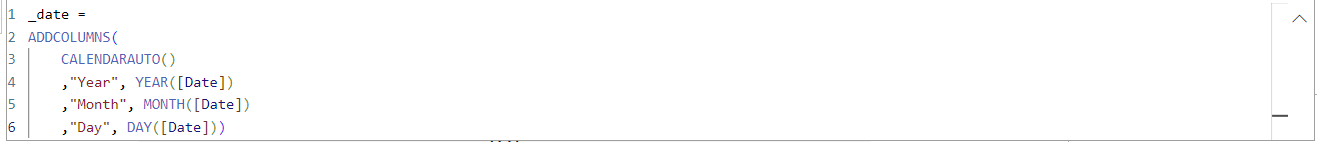
Now we’re adding columns in this table using 'ADDCOLUMNS', and 'CALANDERAUTO'. This adds a continuous date field. After this we’re going to add fields which extract the year, month and day fields from the DATE field using their respective functions. Your calculation should like like the image below:
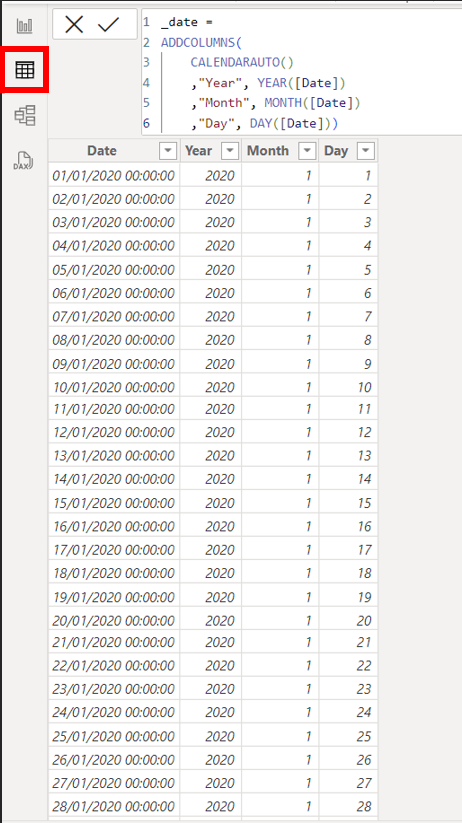
We can have a look at the table view now. Here we can see the date field, along with the 3 we created.
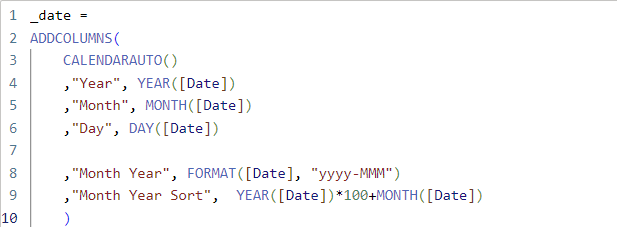
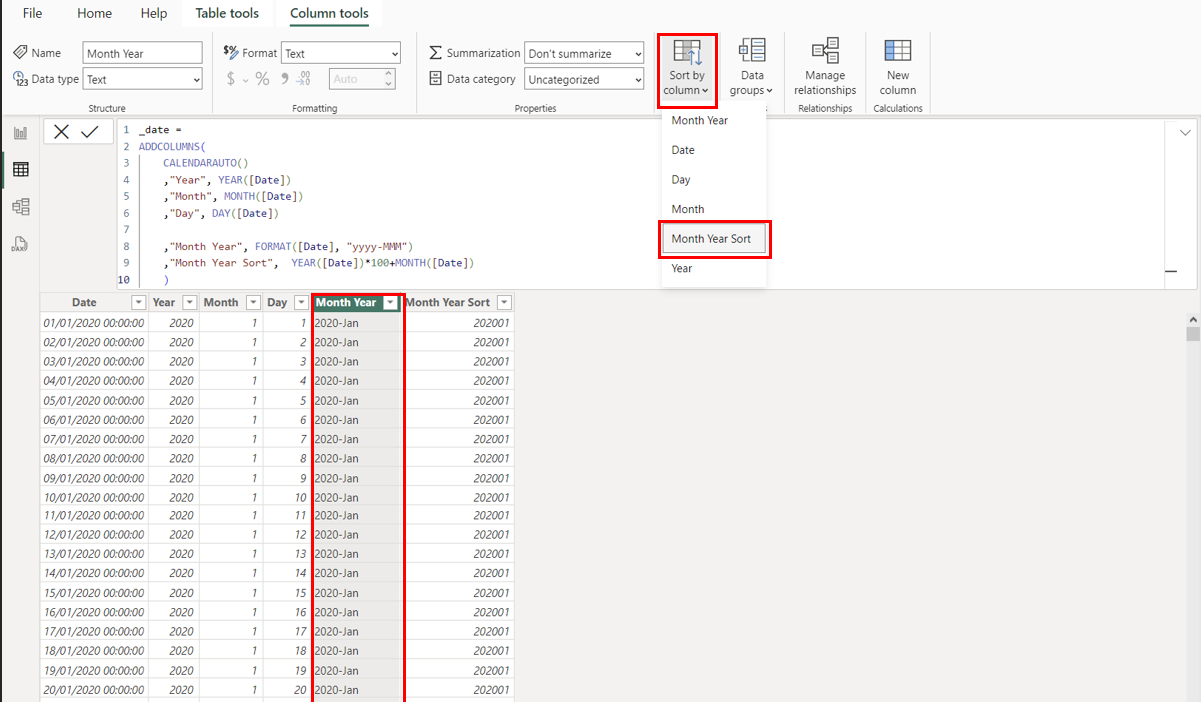
Now we need to create a field called 'MONTH YEAR' within our date table, along with a field to sort it which we're calling 'MONTH YEAR SORT'. We create this sorting field by adding the year multiplied by 100 to the day of the month, and we do this to create a unique numerical value for each combination of month and year in our data.
In the table view, click on the 'MONTH YEAR' field, go to sort by column, and sort it by the 'MONTH YEAR SORT' field.
And now you should be able to create the line graph at the top with 'MONTH YEAR' on the x axis and Sum of Sales in the Y axis!