


Task
Data Preparation
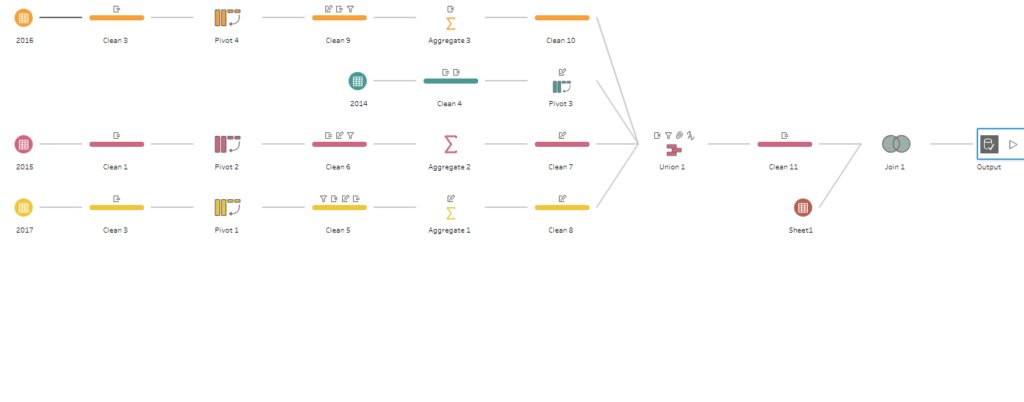
To prepare the data we were only allowed to use Tableau Prep Builder. Given that the data was coming from a survey – I decided to focus only few fields and ended up with 4 columns instead of 20+. Here is my workflow
The Viz
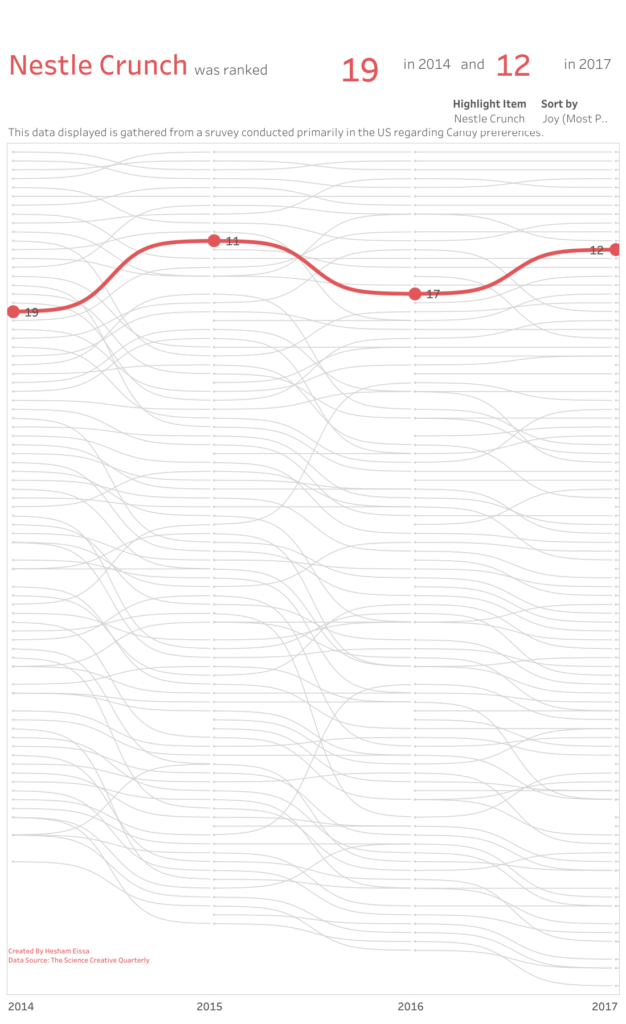
My first thought was to create a bump chart – as I thought the data preparation process would take a lot of time. When I found myself done with data preparation by lunch time I decided to make my bump chart curvy! and luckily found this blog posts that details out the process : https://newprediction.com/tableau-smooth-bump-chart/ – also found this blog post from Laine : /laine-caruzca/dashboard-week-day-4-major-league-baseball/
here is my viz:
Thoughts
Given that our task to create the dashboard on Tableau Server – I think I risked it by creating this chart because I had to duplicate my records 49 times to create path between points. Luckily, I did it one time!!
It is also obvious that my viz needs some formatting and alignment but unfortunately a lot of Tableau Desktop features are not available on Tableau Server