


One of the most important tools in presenting your analysis effectively are your KPIs, which provide an overview of your data and the most important takeaways for viewers. Different visualization programs provide different options in presenting these numbers, with Power BI, one of the most popular tools for analysis and visualization, offering two. Both options can be viable in most reports, but each has slight drawbacks and benefits depending on your data.
KPI
When reporting KPIs in Power BI, the visual most would initially select in the panel is the "KPI" option.
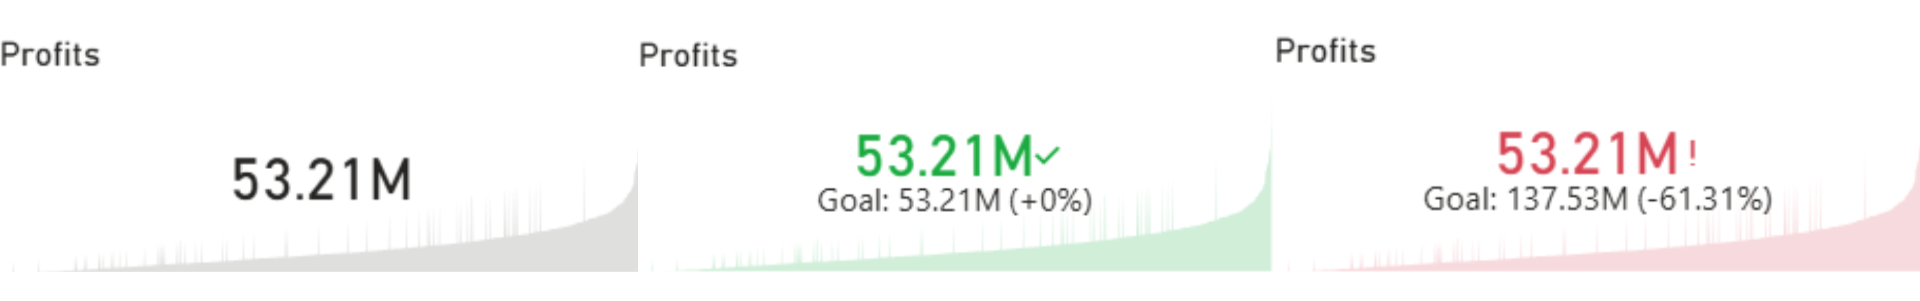
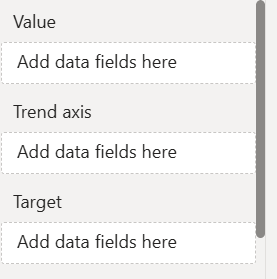
The KPI option allows you to select three main measures to compare: your value (the main reported figure in the center), your target (the number your value is compared against), and your trend axis (the graph in the background).
The KPI option allows you to easily and clearly report your most important numbers, with built in color-coding for additional clarity. The subheading stating your percentage increase or decrease further adds to the clarity of your reporting. However, depending on your plan for your visualization and the history of reporting on your dataset, you may decide that the KPI visual is the right fit for your report.
Card
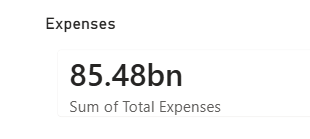
The second option for your KPI reporting is the "Card" visual. The card provides far less information than the KPI visual, but can be easier when formatting. While the KPI visual can only accommodate one center value at a time, the card visual can have several dragged into a single container at once, making it much simpler to keep your formatting consistent.
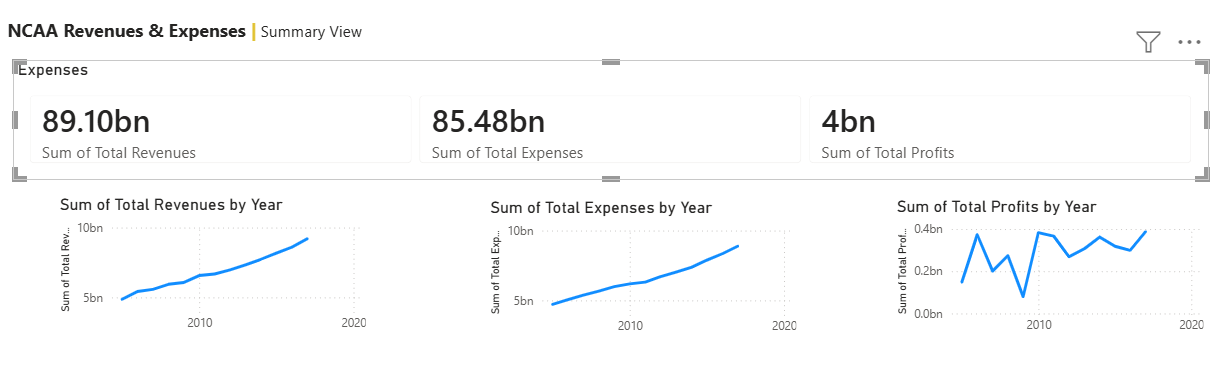
If your report is already visually cluttered and the rest of your visuals are too important to reduce, a card can also lower the risk of cluttering your report to point of losing easy readability.
The KPI option also loses its value in the case that you're reporting on data that has not been reported on yet or has not been assigned targets, making a card the better path to providing a clear initial report.
Regardless of your choice, just make sure it's the best one for your dataset and report!