


A table calculation is a transformation you apply to the values in a visualisation. Table calculations are a special type of calculated field that computes on the local data in Tableau. They are calculated based on what is currently in the visualisation and do not consider any measures or dimensions that are filtered out of the visualisation.
There are many different types of table calculations but a useful one to look at is the Difference From calculation.
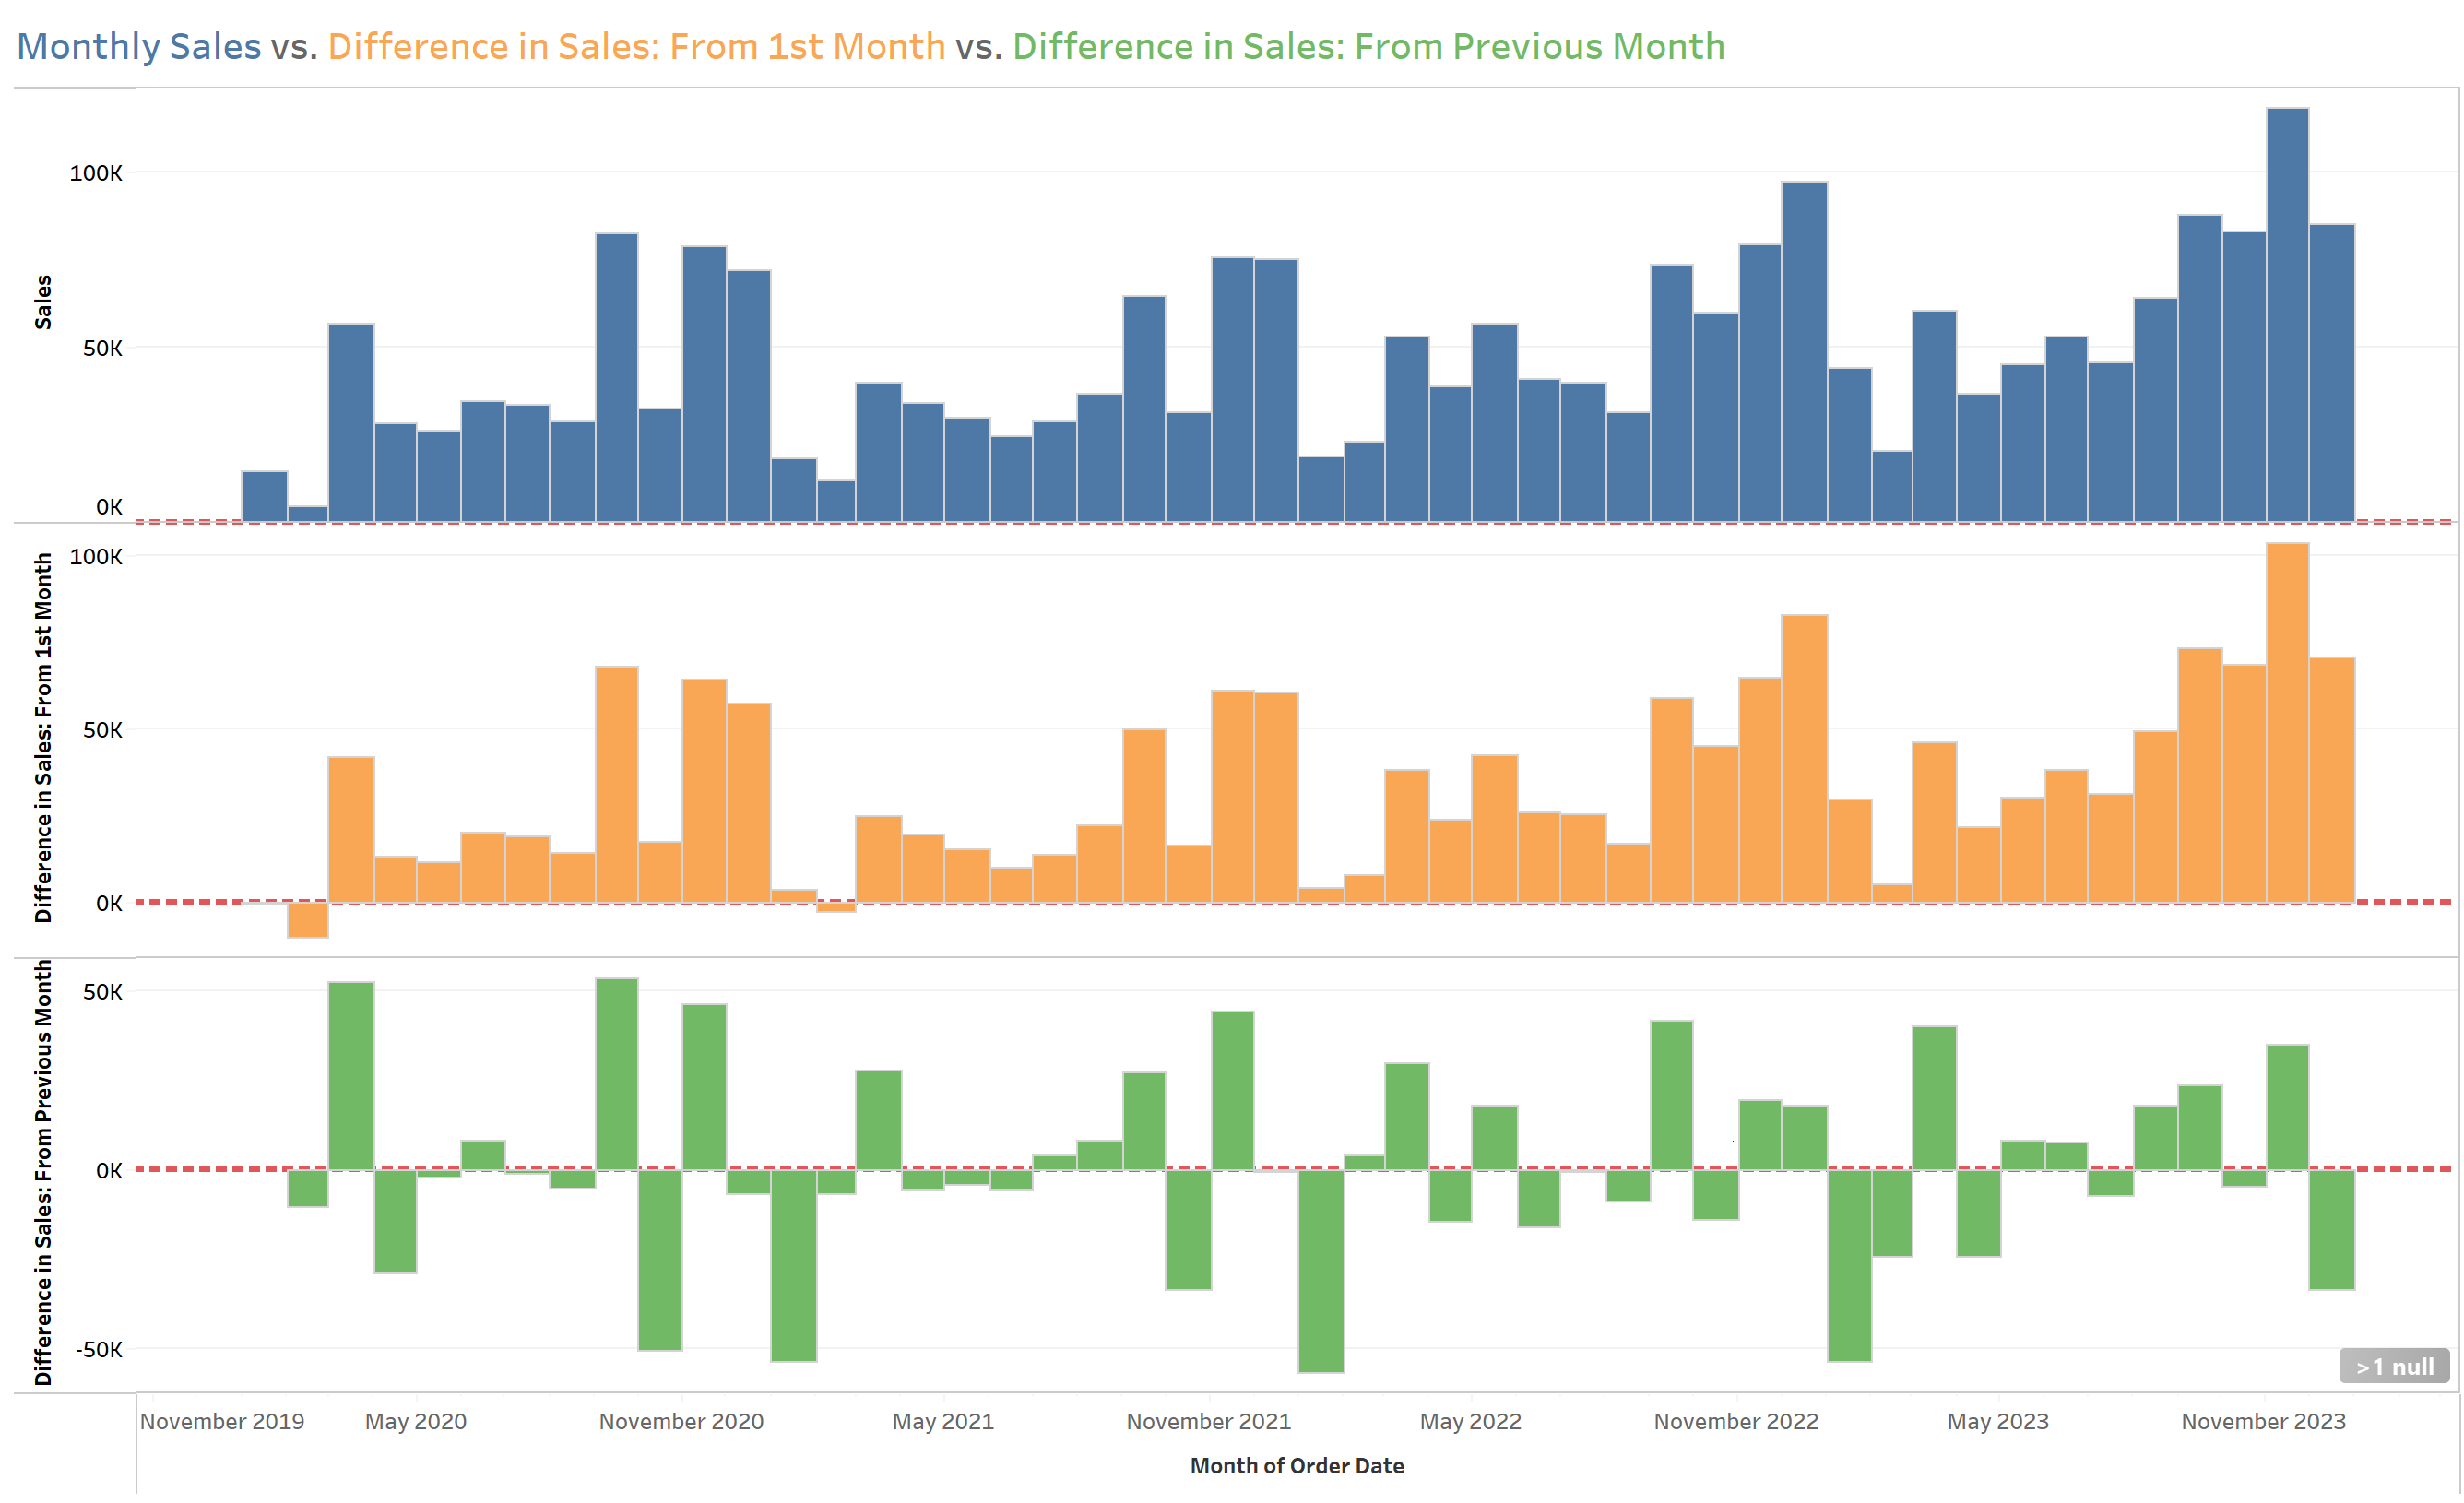
A Difference From table calculation computes the difference between the current value and another value in the table for each mark in the visualisation. Using it, we can create this graph.
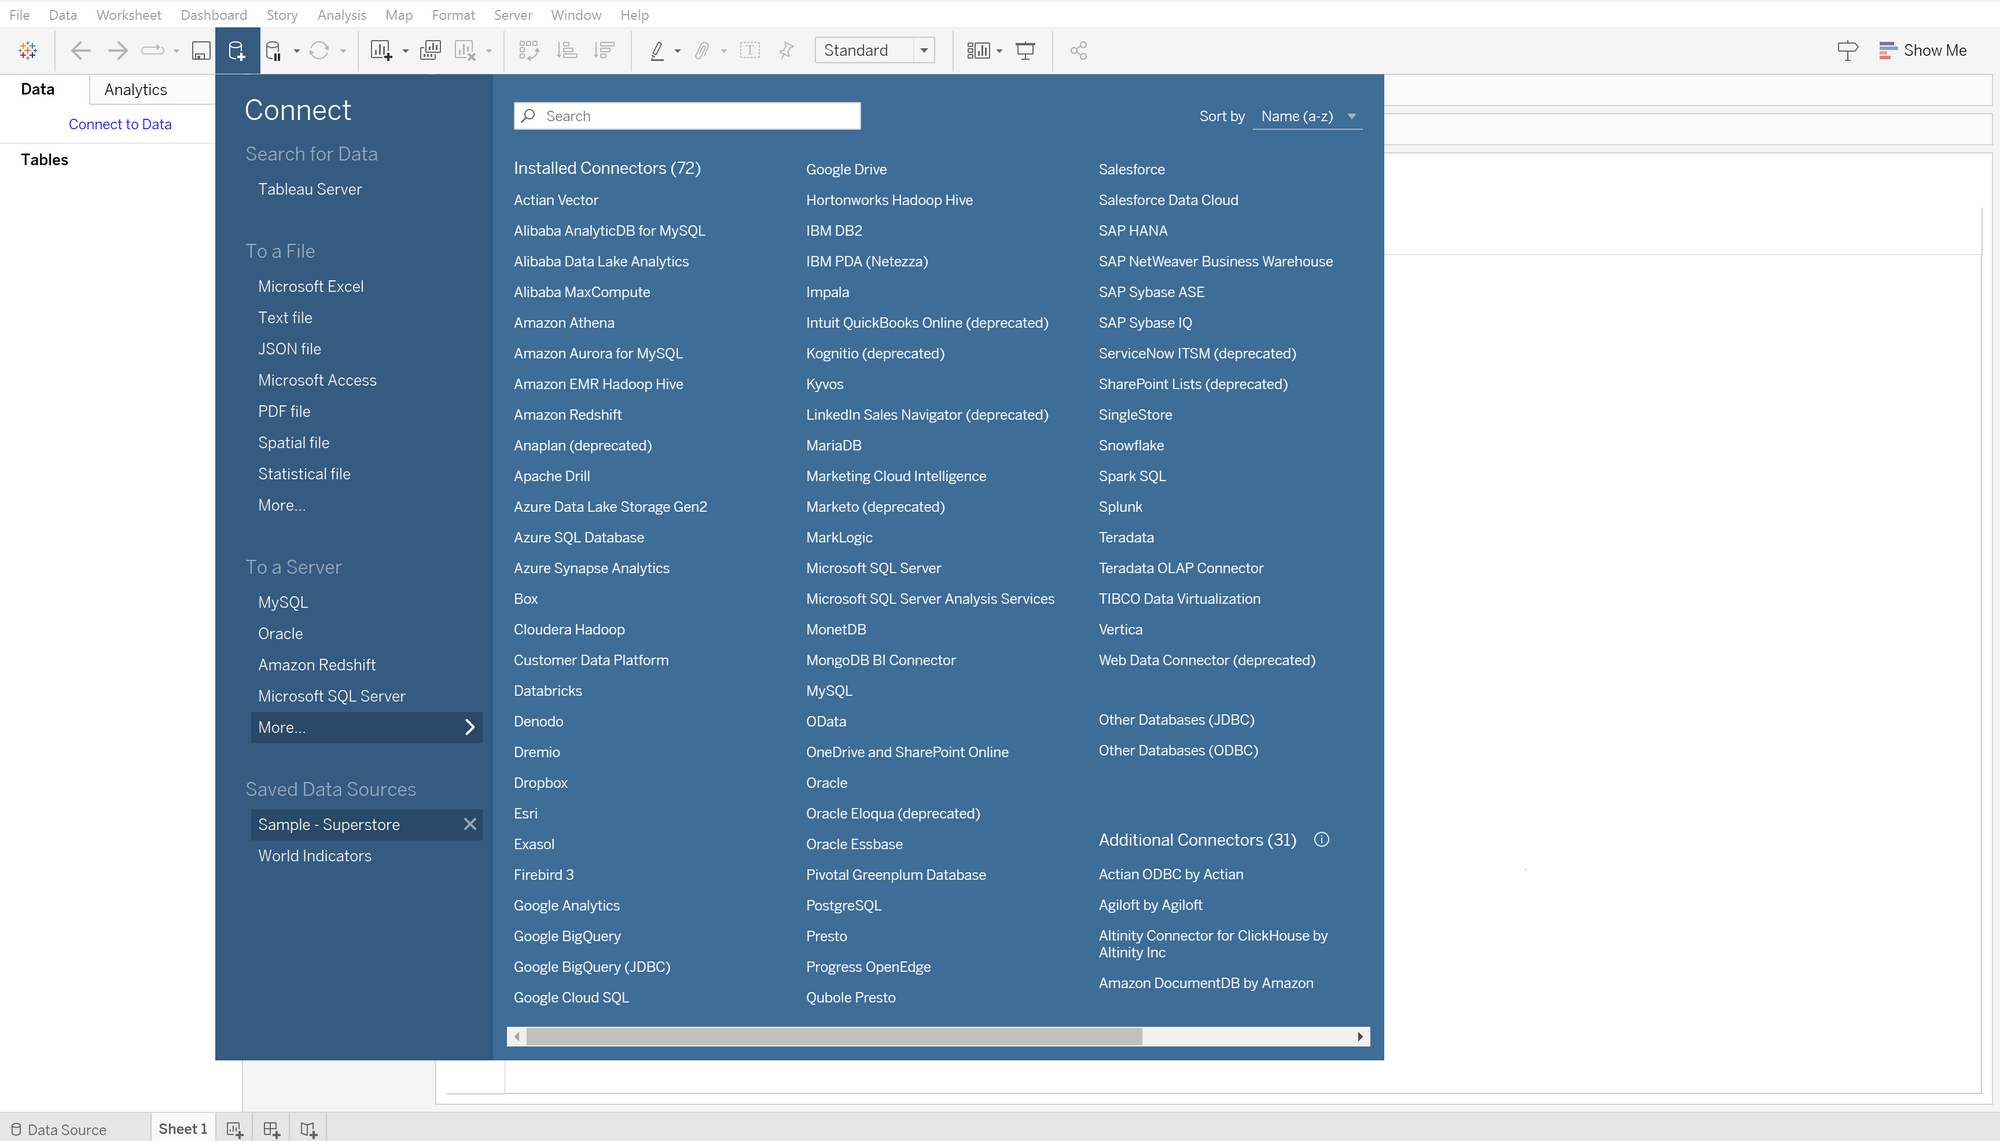
Step 0- Open the Data!
Step 1- Making the Graphs
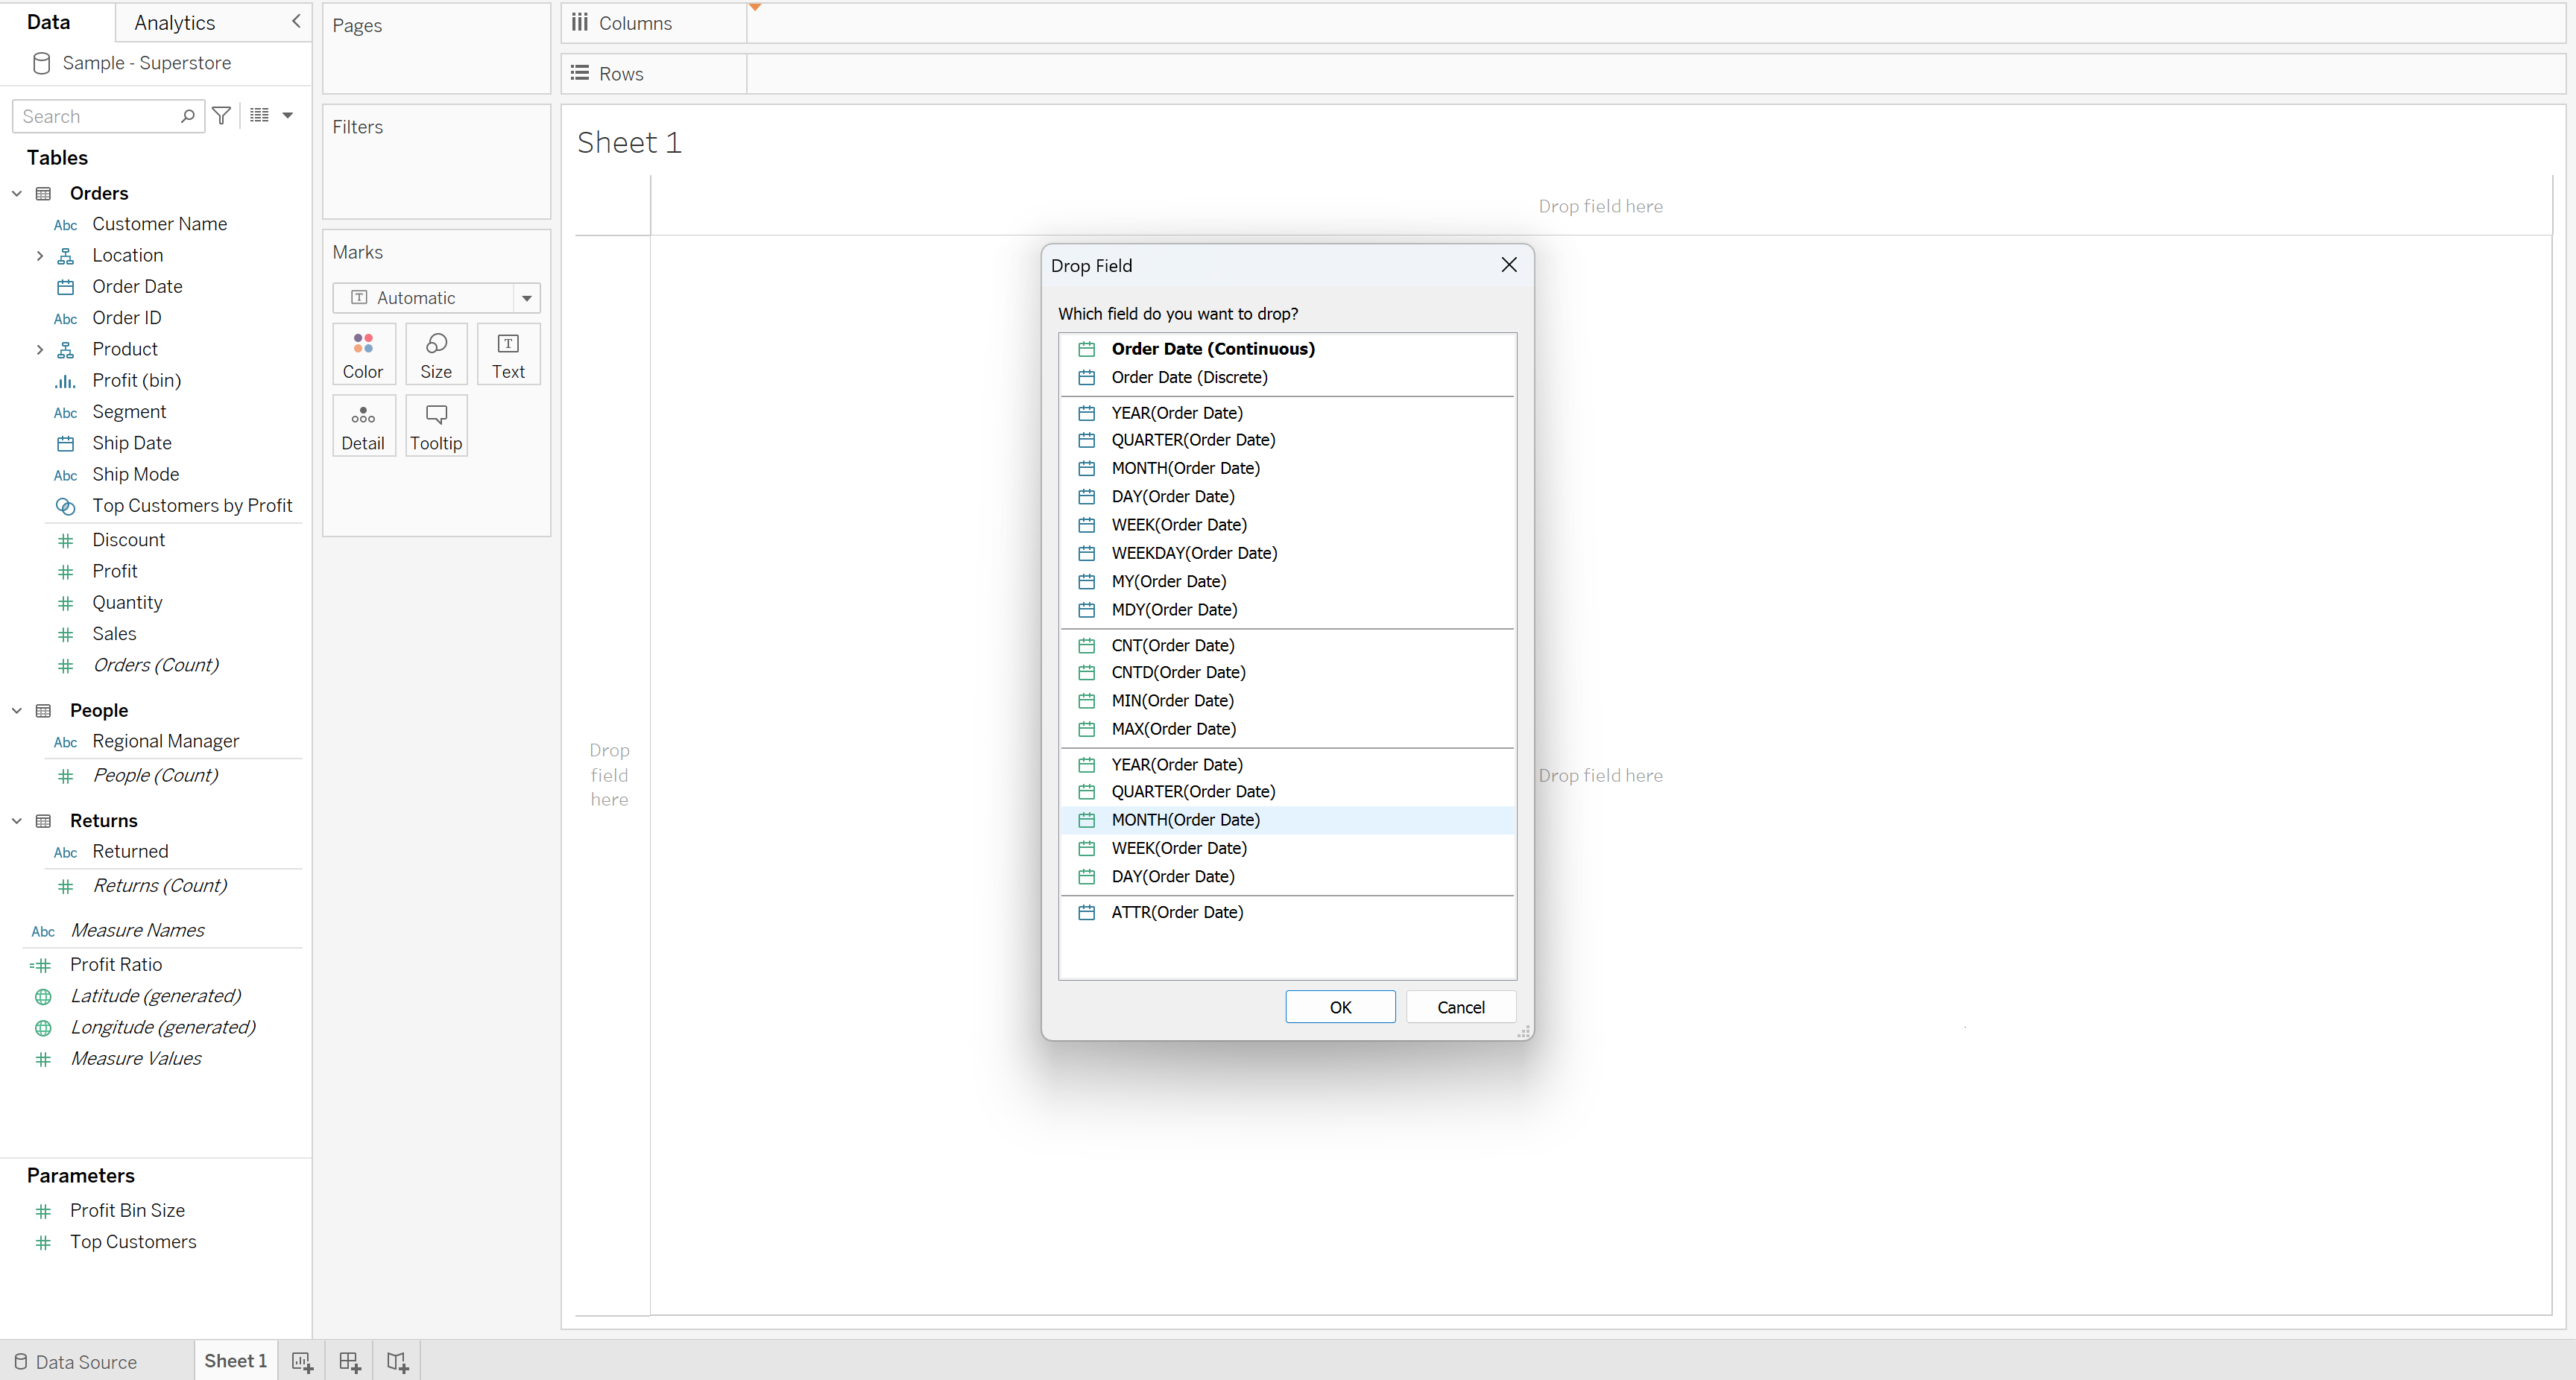
First, Right-Click and drag your Order Date Field to the Columns Section at the top of the sheet, a window should pop up. Tableau automatically generates a time hierarchy for that date field, allowing you to pick if you want you date continuous or discrete as well as the specificity of the date such as Year, Quarter, Month etc.
For this graph, we want the continuous month of the order date. This will give us every month and year from January 2020 to December 2023.
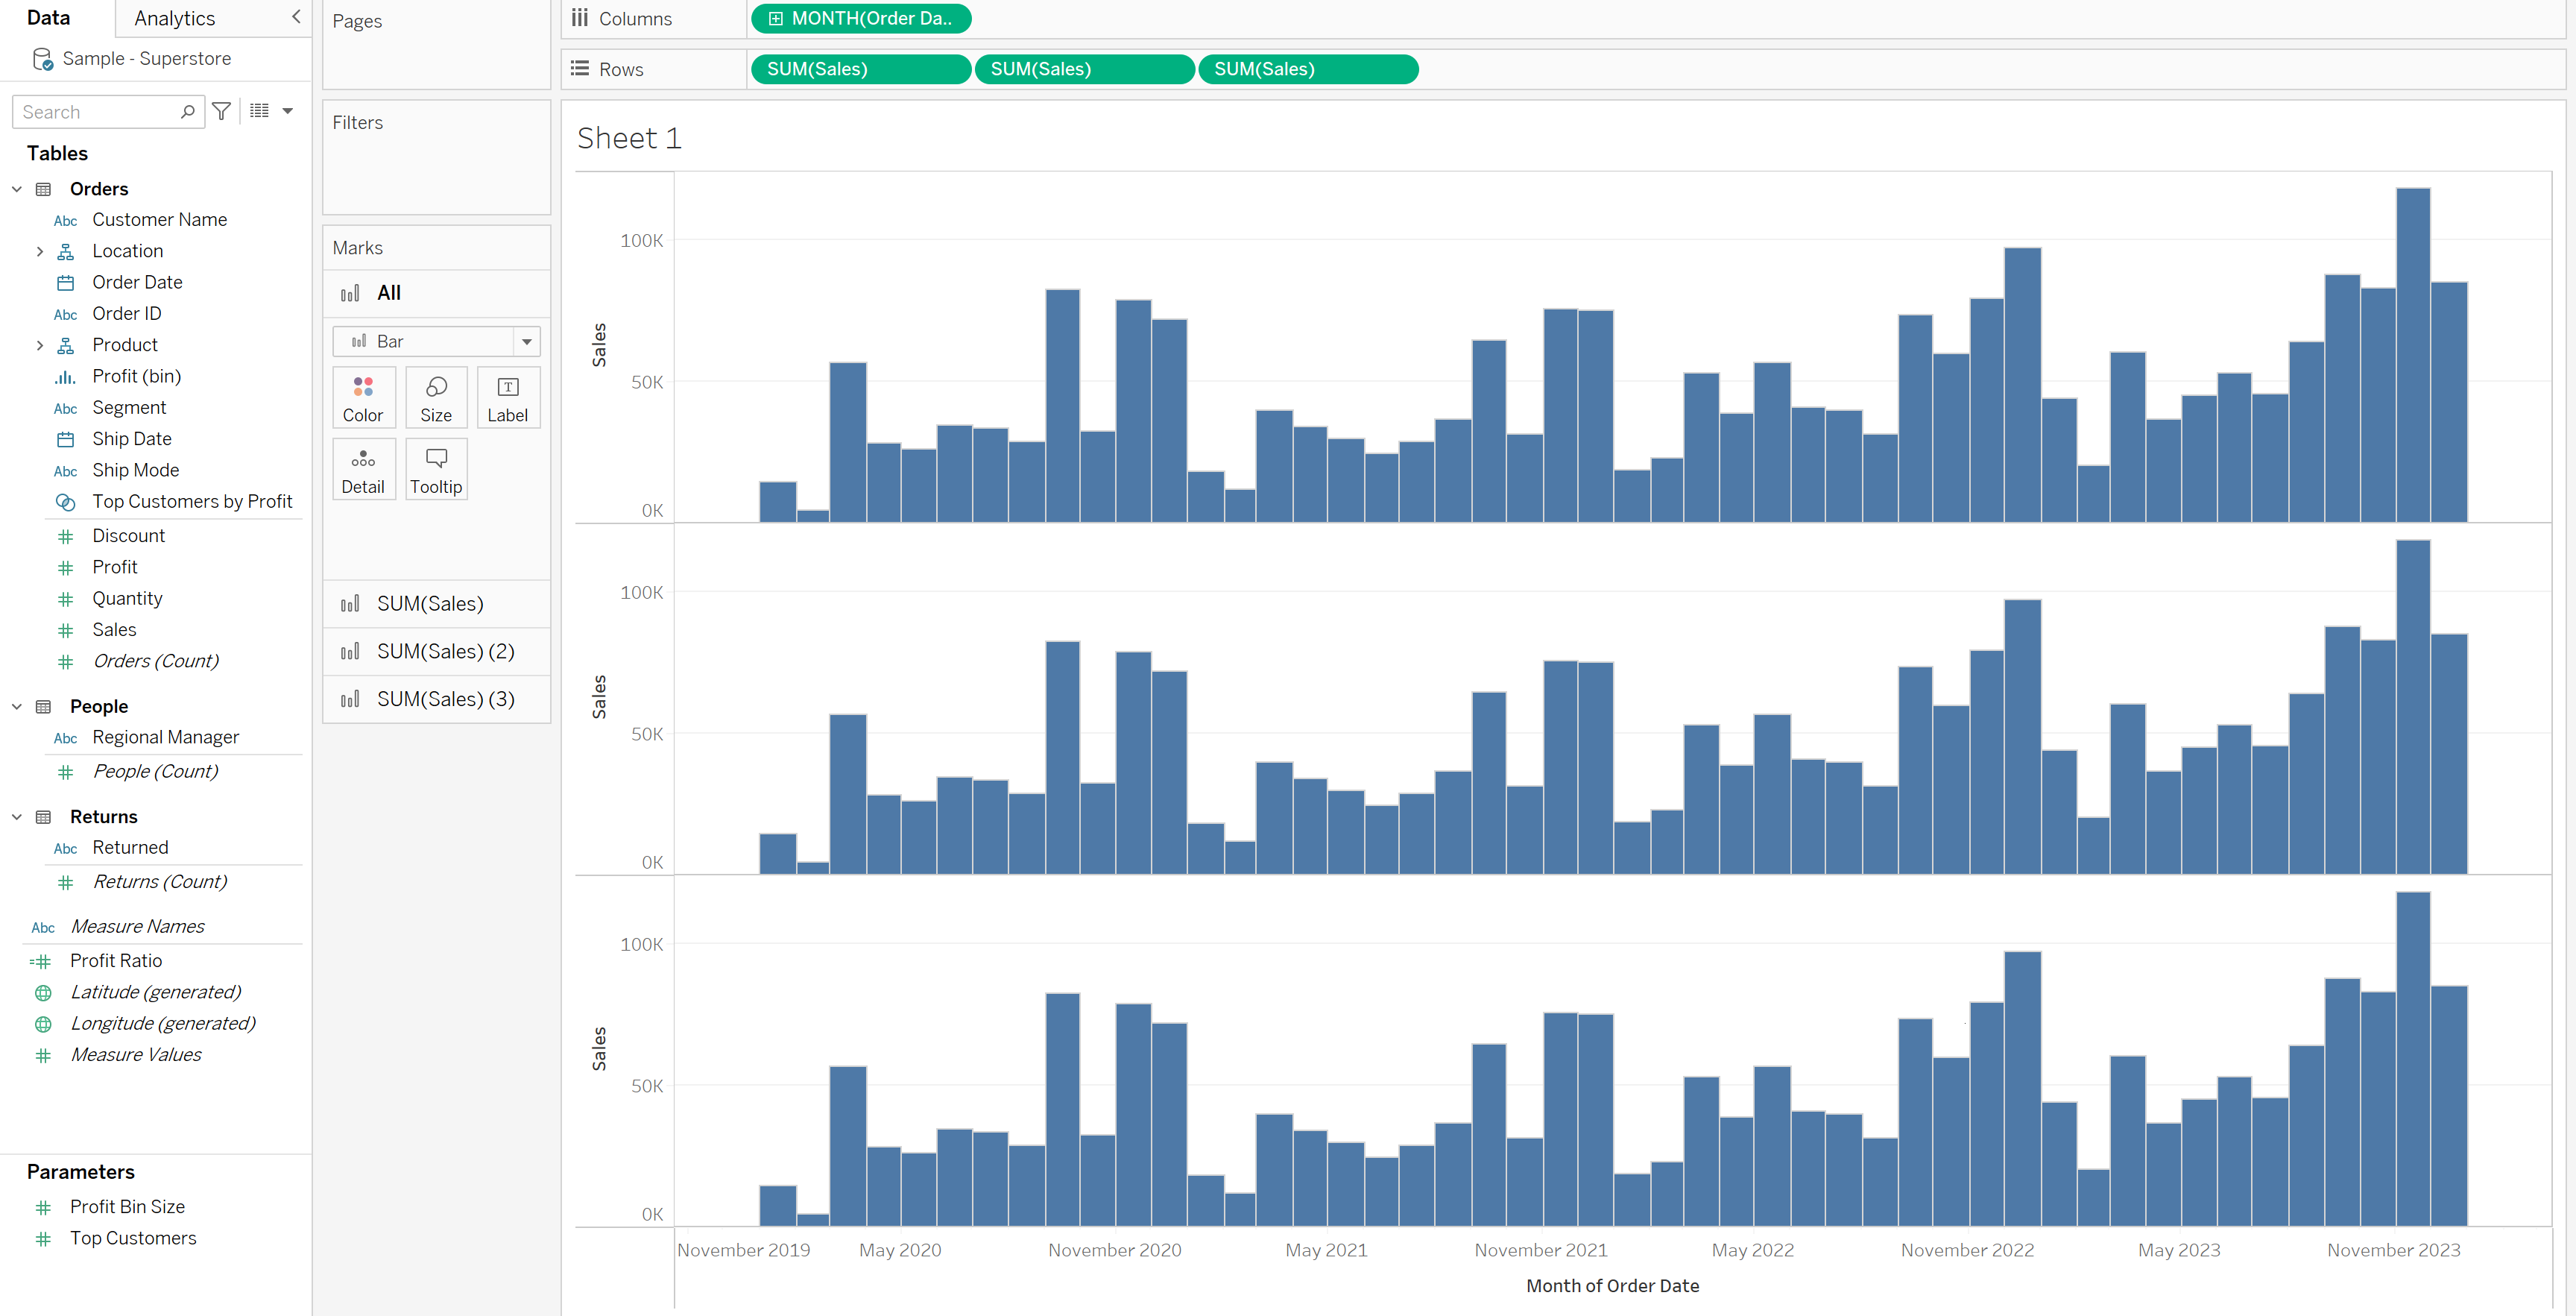
Next, drag the Sales field to Rows three times, this will make three identical charts.
Step 2- Using Table Calculations
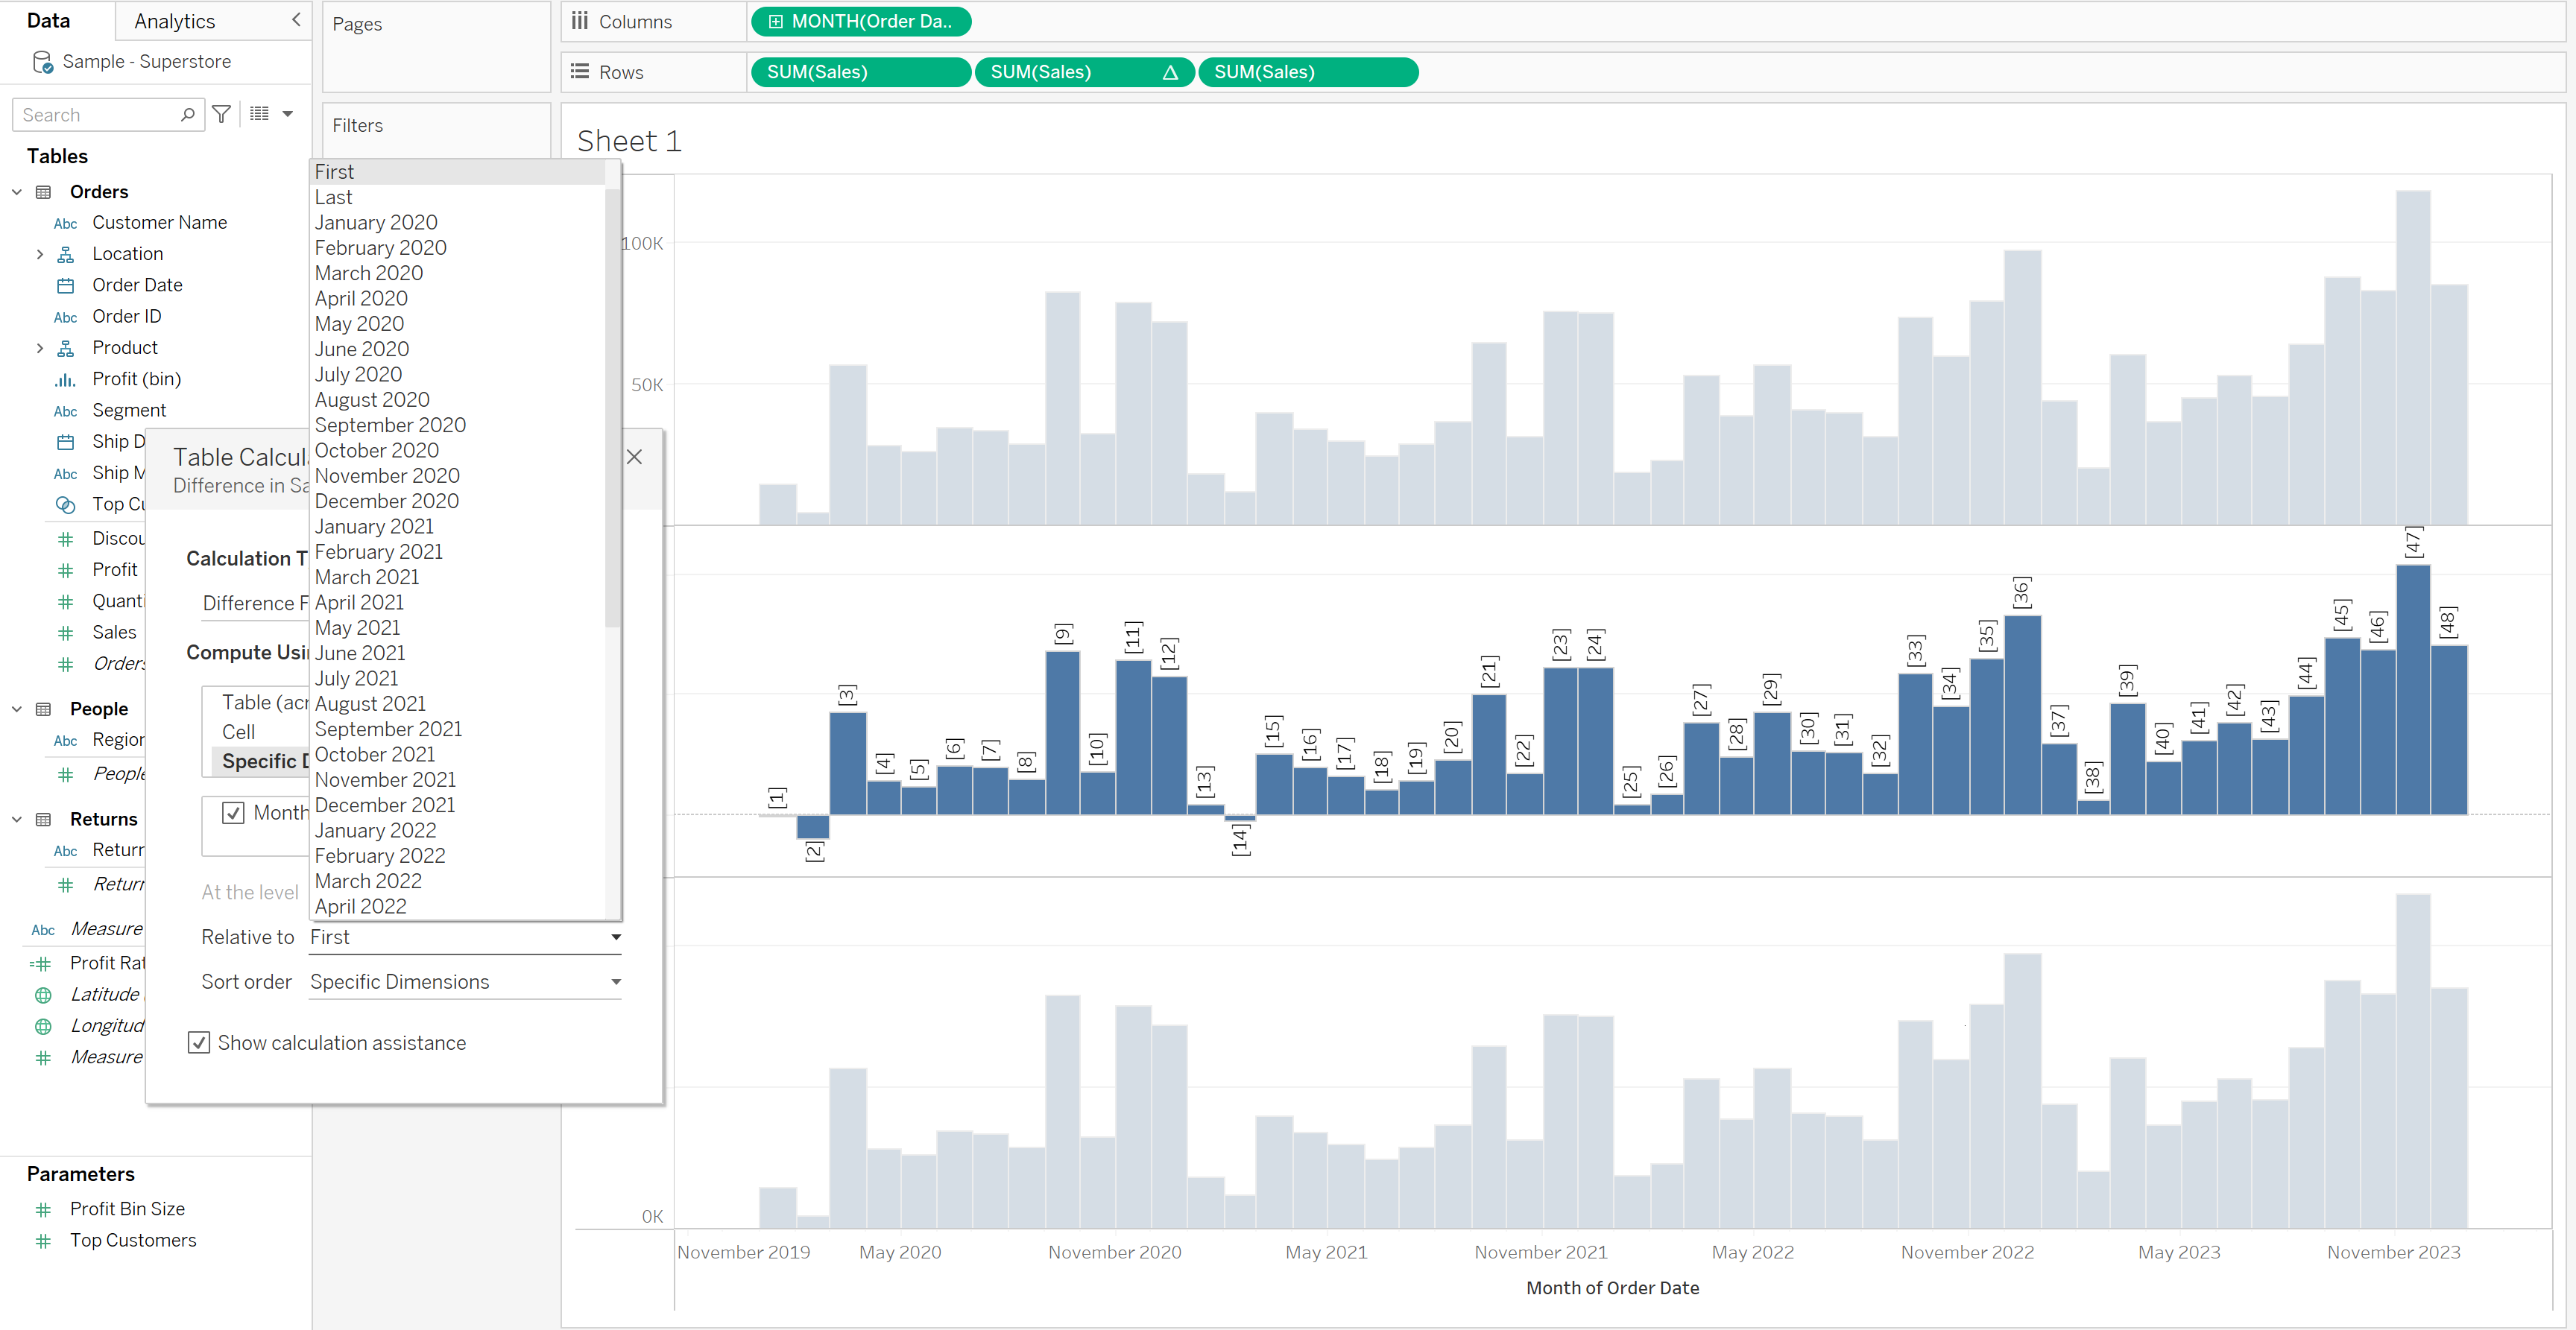
The first graph we want to show is the difference from the first month. When analysing data, some companies might want to take the first month recorded as a benchmark to compare from.
On the second Sum of Sales Field, Right-Click or Click the Down Arrow, a drop down will appear where you can select 'Add Table Calculation...'.
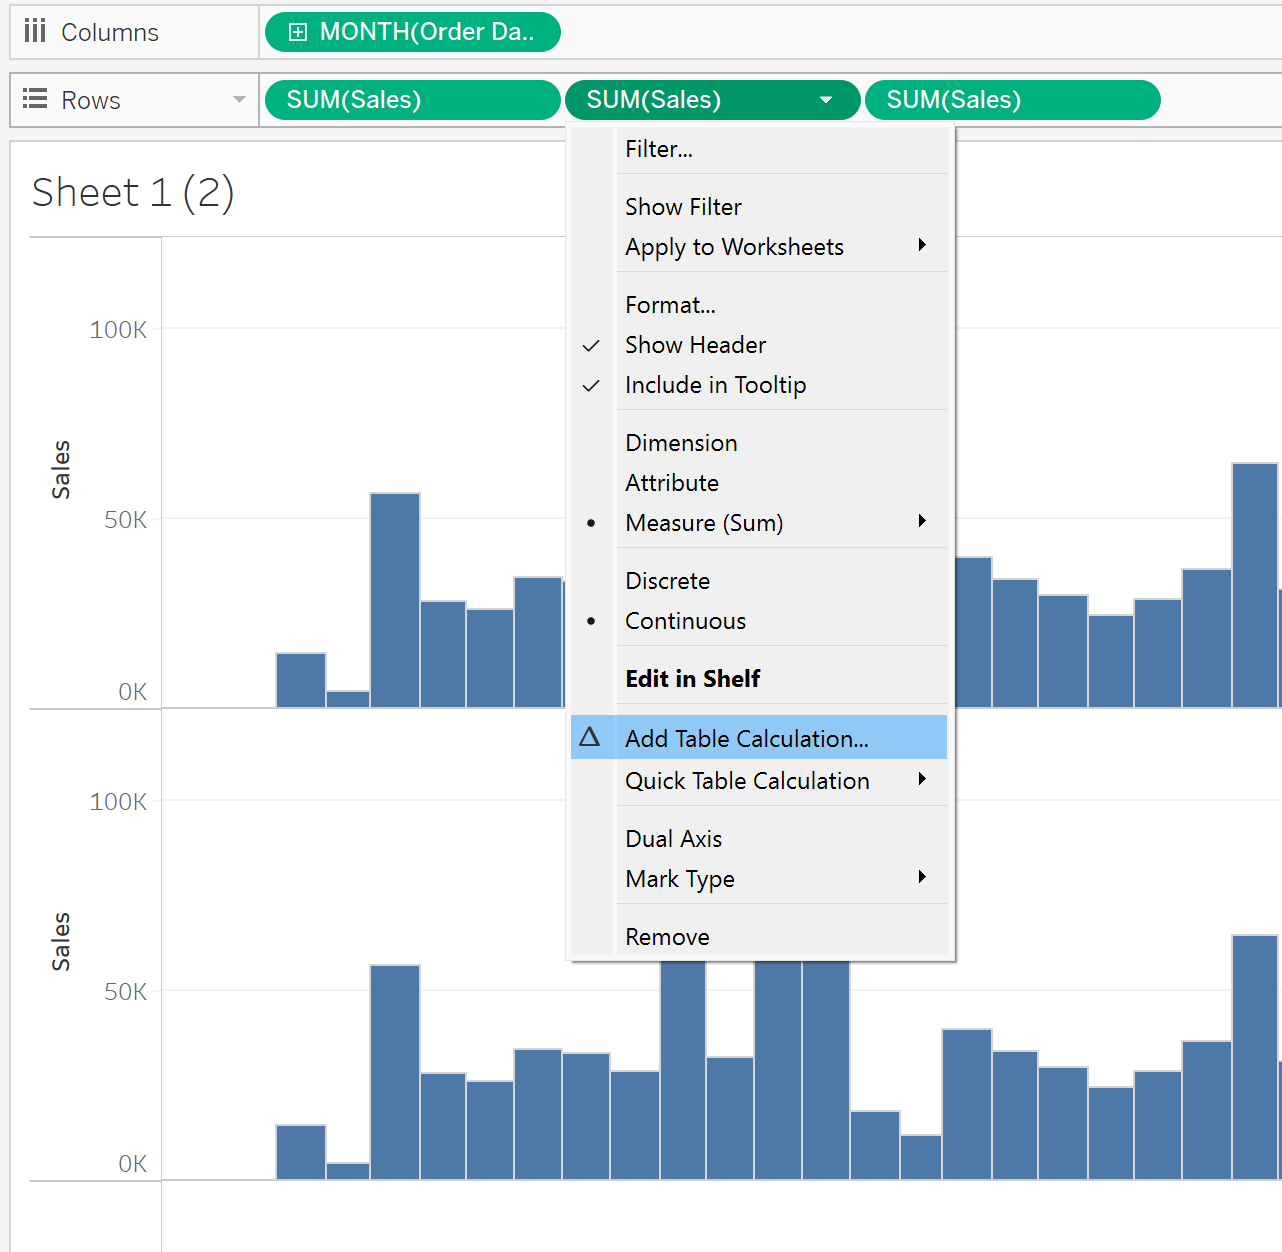
This will open up the Table Calculation window, this window can be difficult to understand so here is a quick guide to understand it:
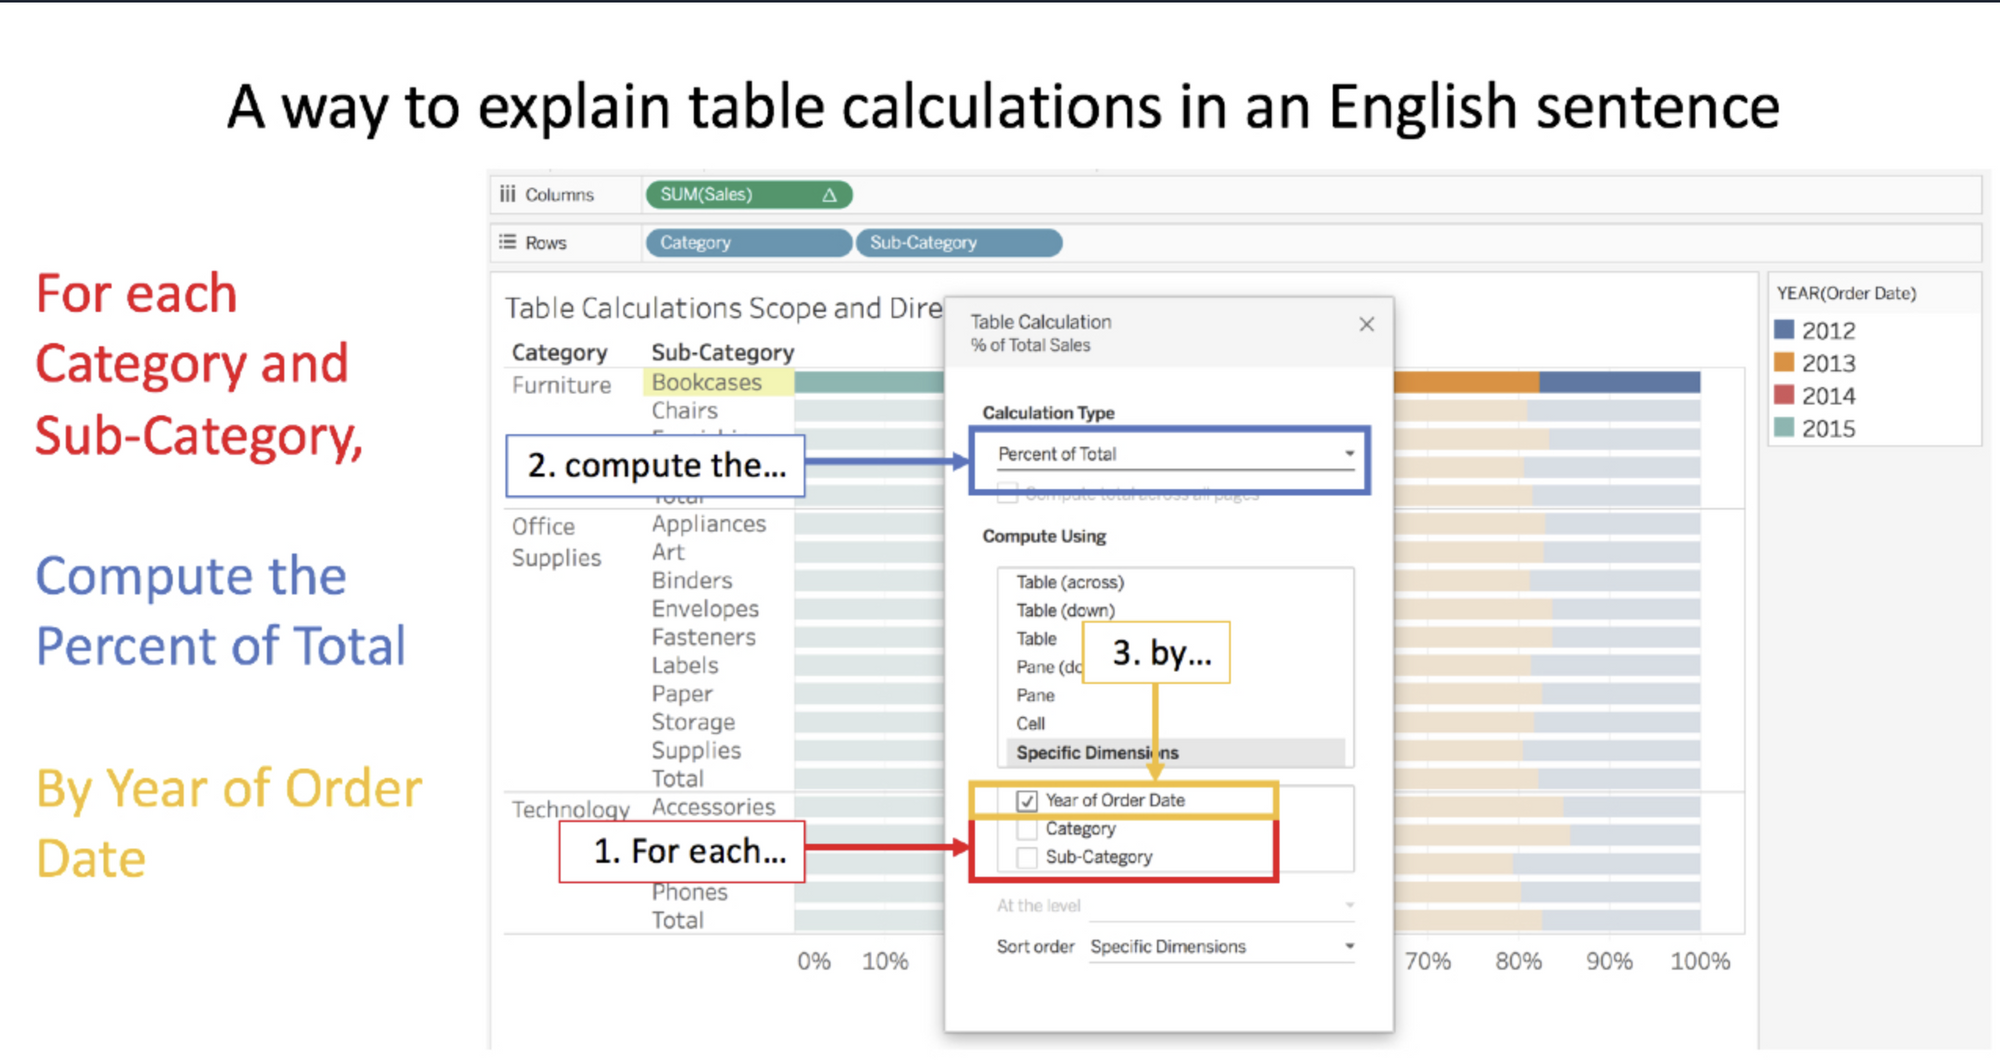
So, for our Table Calculation, we are asking:
For each... [Remains Blank]
Compute the... Difference From
By... Month of Order Date
In the Relative to section, we want to click First as we are looking at how all the months differ from the first month (January 2020).
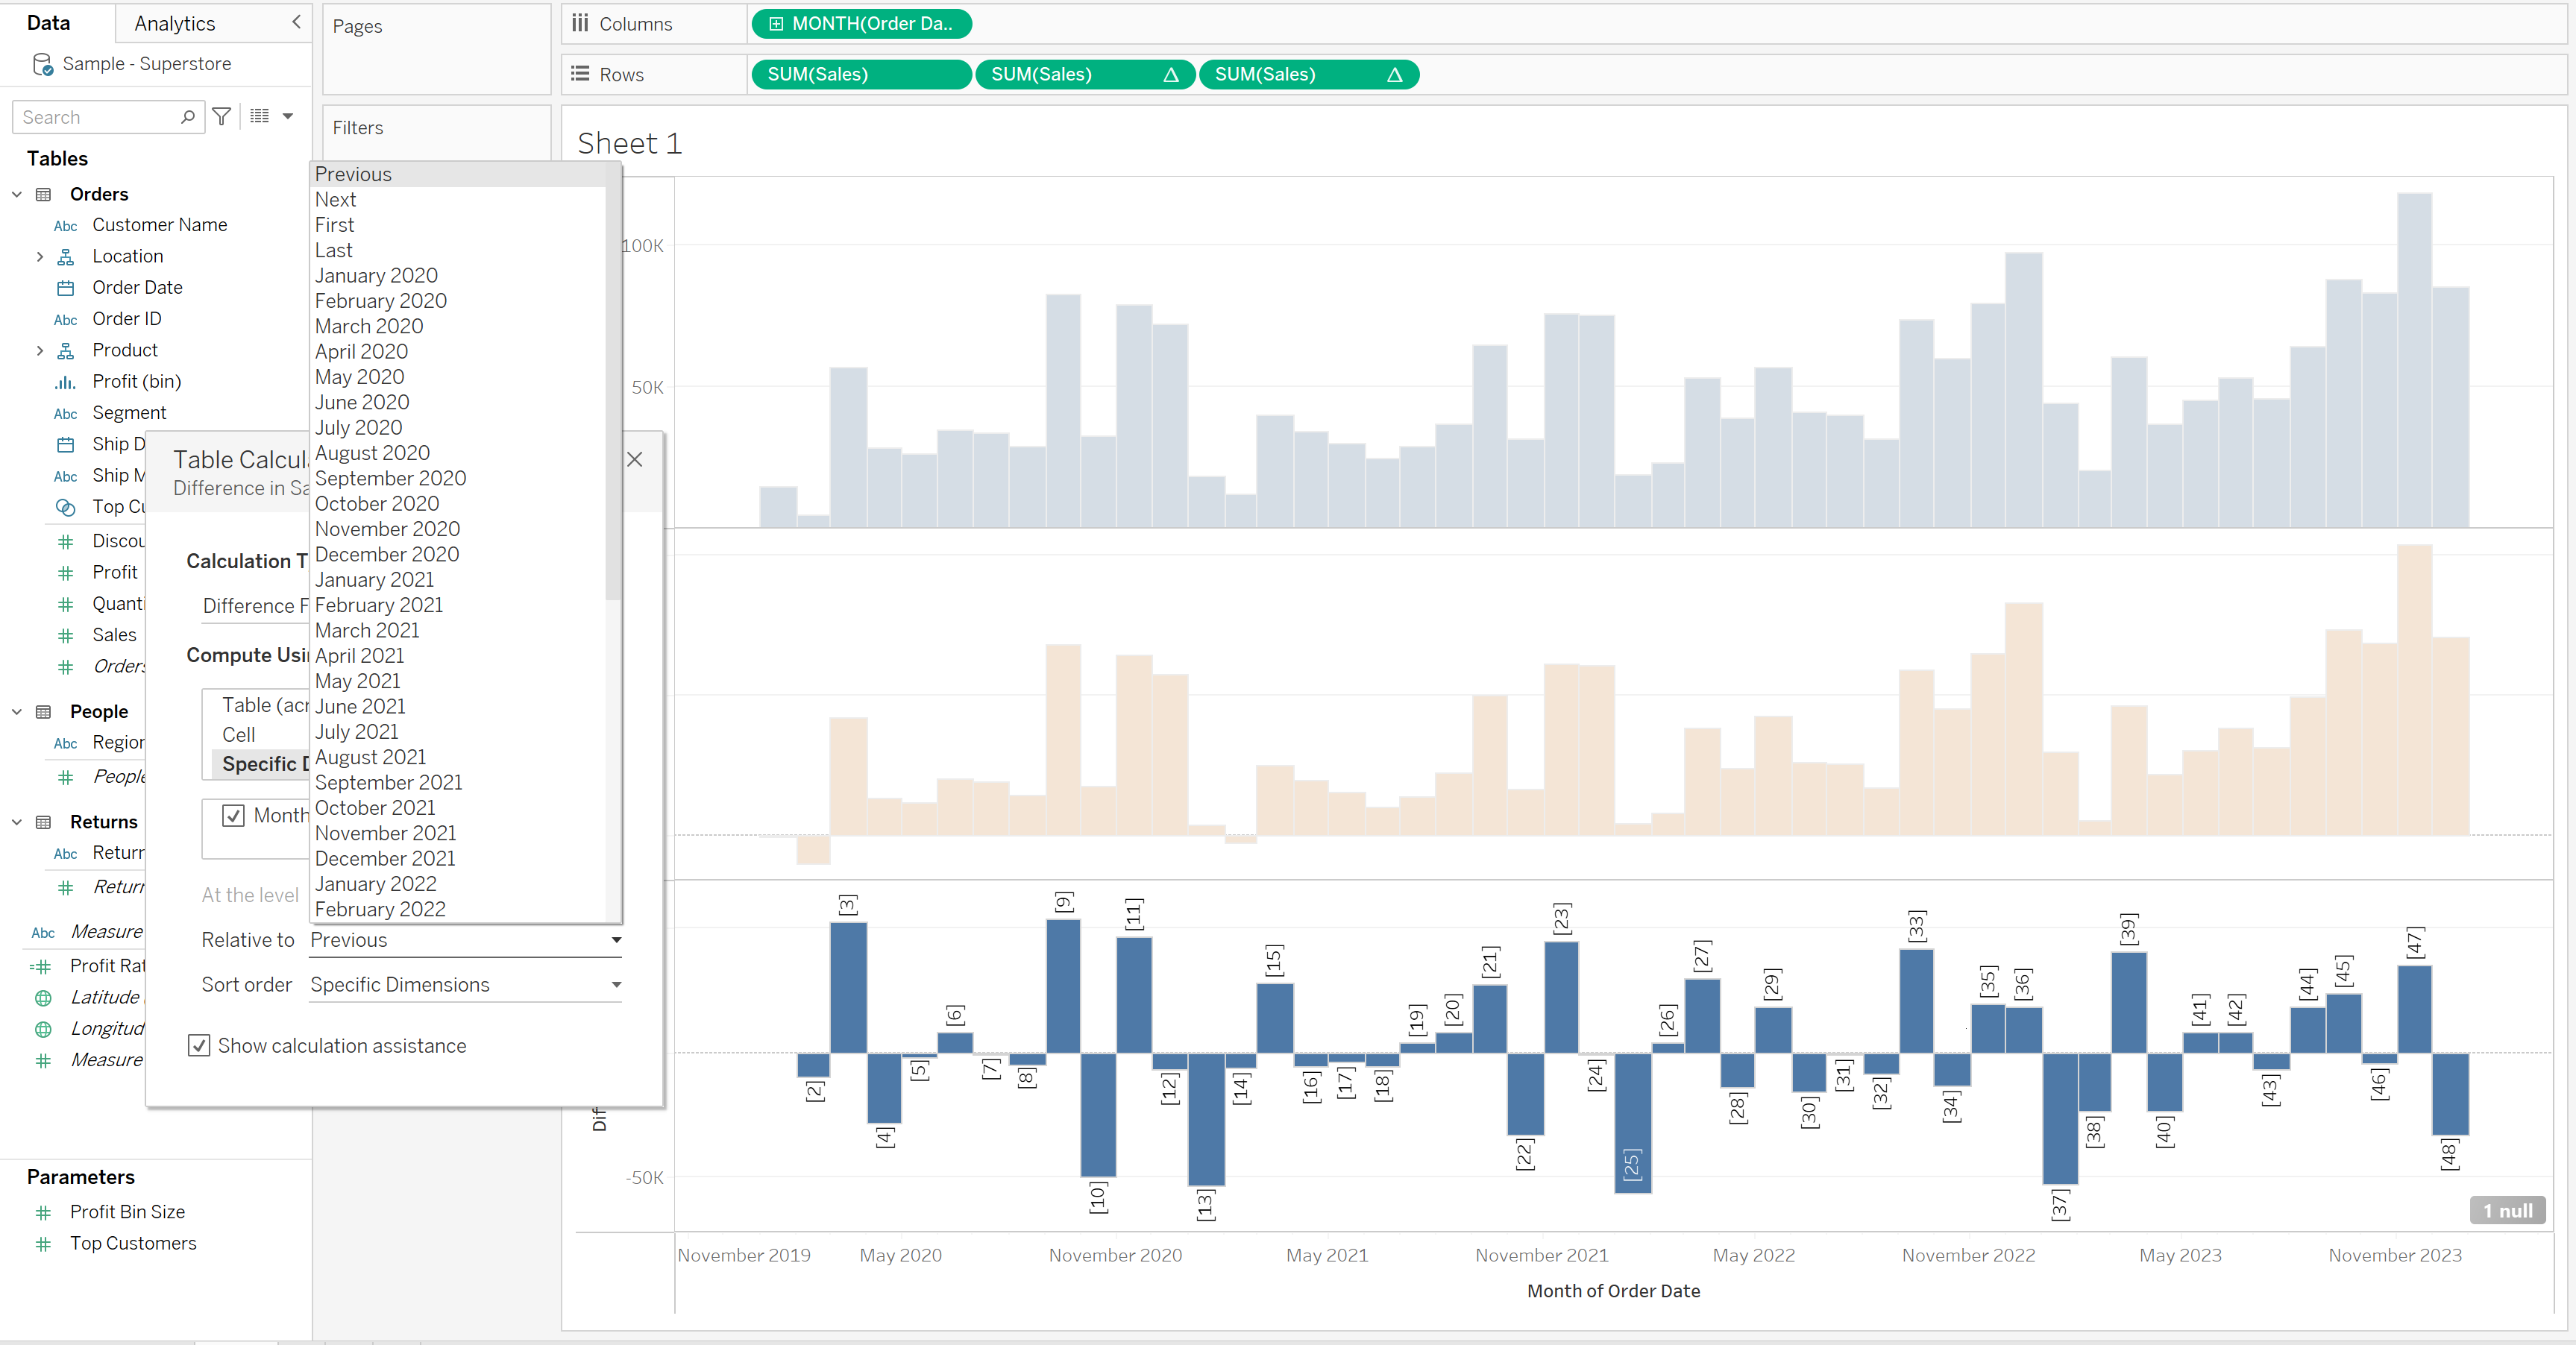
The final chart we'll make is the difference from the previous month, this can be useful for companies to see how their performance changes each month. For the third Sum of Sales Field, repeat the previous step but instead of First, we want Previous!
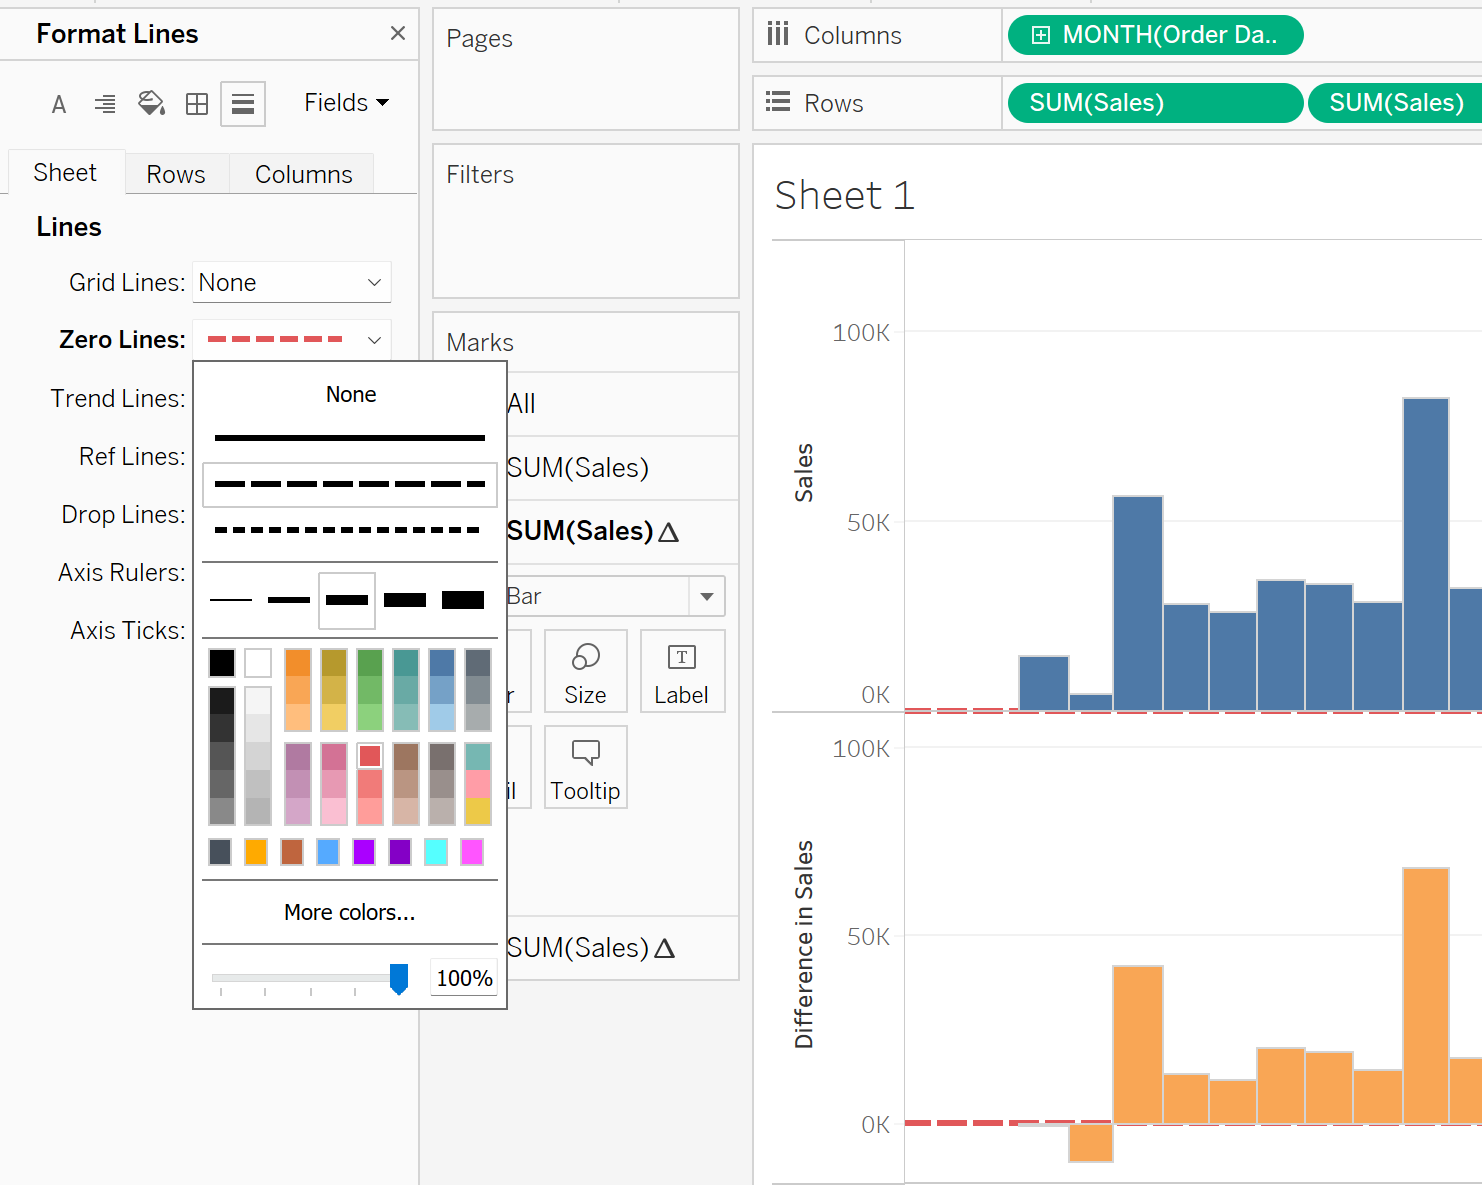
And thats it! All we have to do now is changing the colours, title and formatting, I also added a red zero line so it stands out. All you have to do is right click the graph, click format, click on the icon with 3 lines, then change Zero Lines to whatever you want.
In summary, Tableau's "Difference From" calculation is a valuable tool for organisations, enabling dynamic data comparison against a reference point, often the first month recorded. This feature facilitates trend analysis, performance evaluation, and strategic decision-making, offering insights into growth opportunities, market trends, and effective resource allocation. With this functionality, Tableau empowers businesses to make informed, data-driven decisions by providing a clear perspective on their performance dynamics over time.