


A "Percent Difference From" table calculation computes the percentage disparity between the current value and another specified value within the table for each data point.
When employing a "Difference From," "Percent Difference From," or "Percent From" calculation, it involves considering two distinct values: the present value being analysed and the reference value against which the difference or percentage is measured.
Let's go through some examples with fake sales data from a international store.
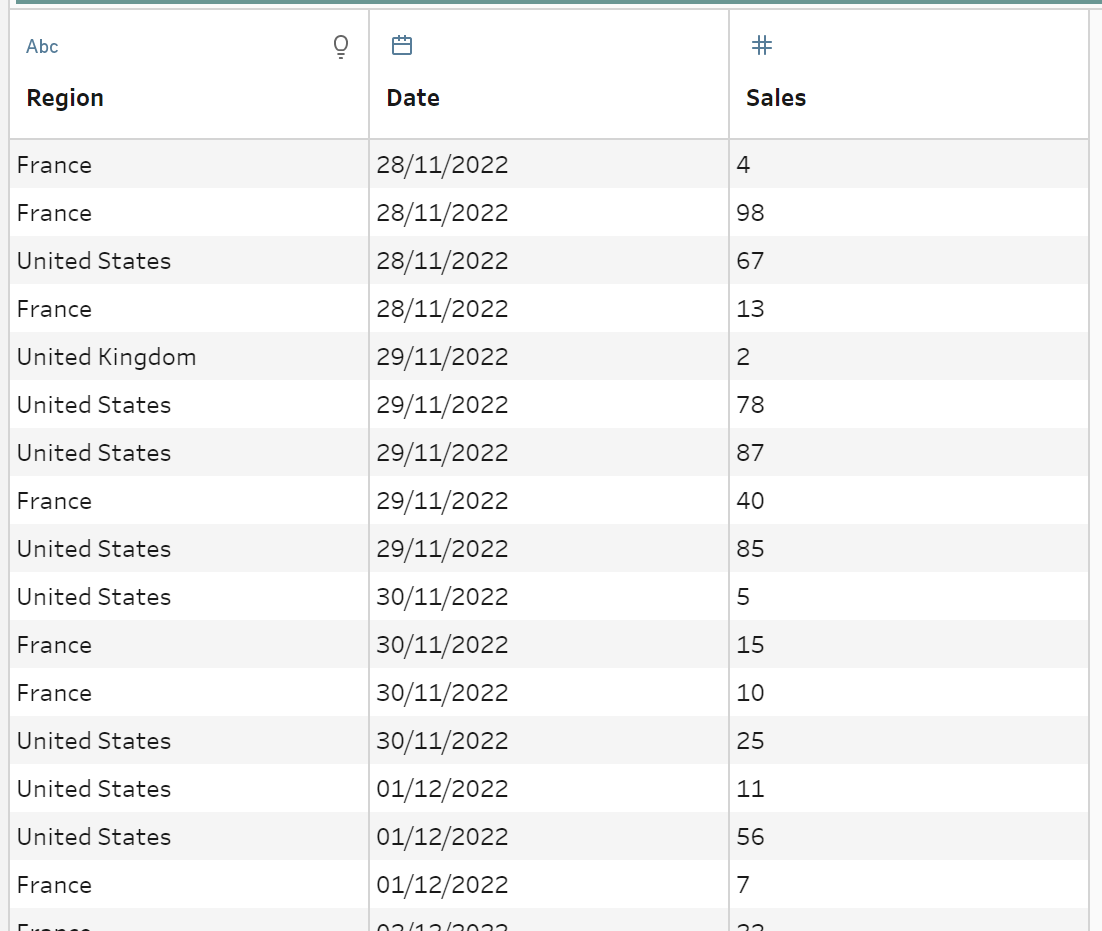
First, we want to look at the percentage difference between sales each day for each region.
To start, import the data and go to the data profiling section in the clean step. Click on the three dots in the sales field overview, go to Create Calculated Field and Select Precent Difference From.
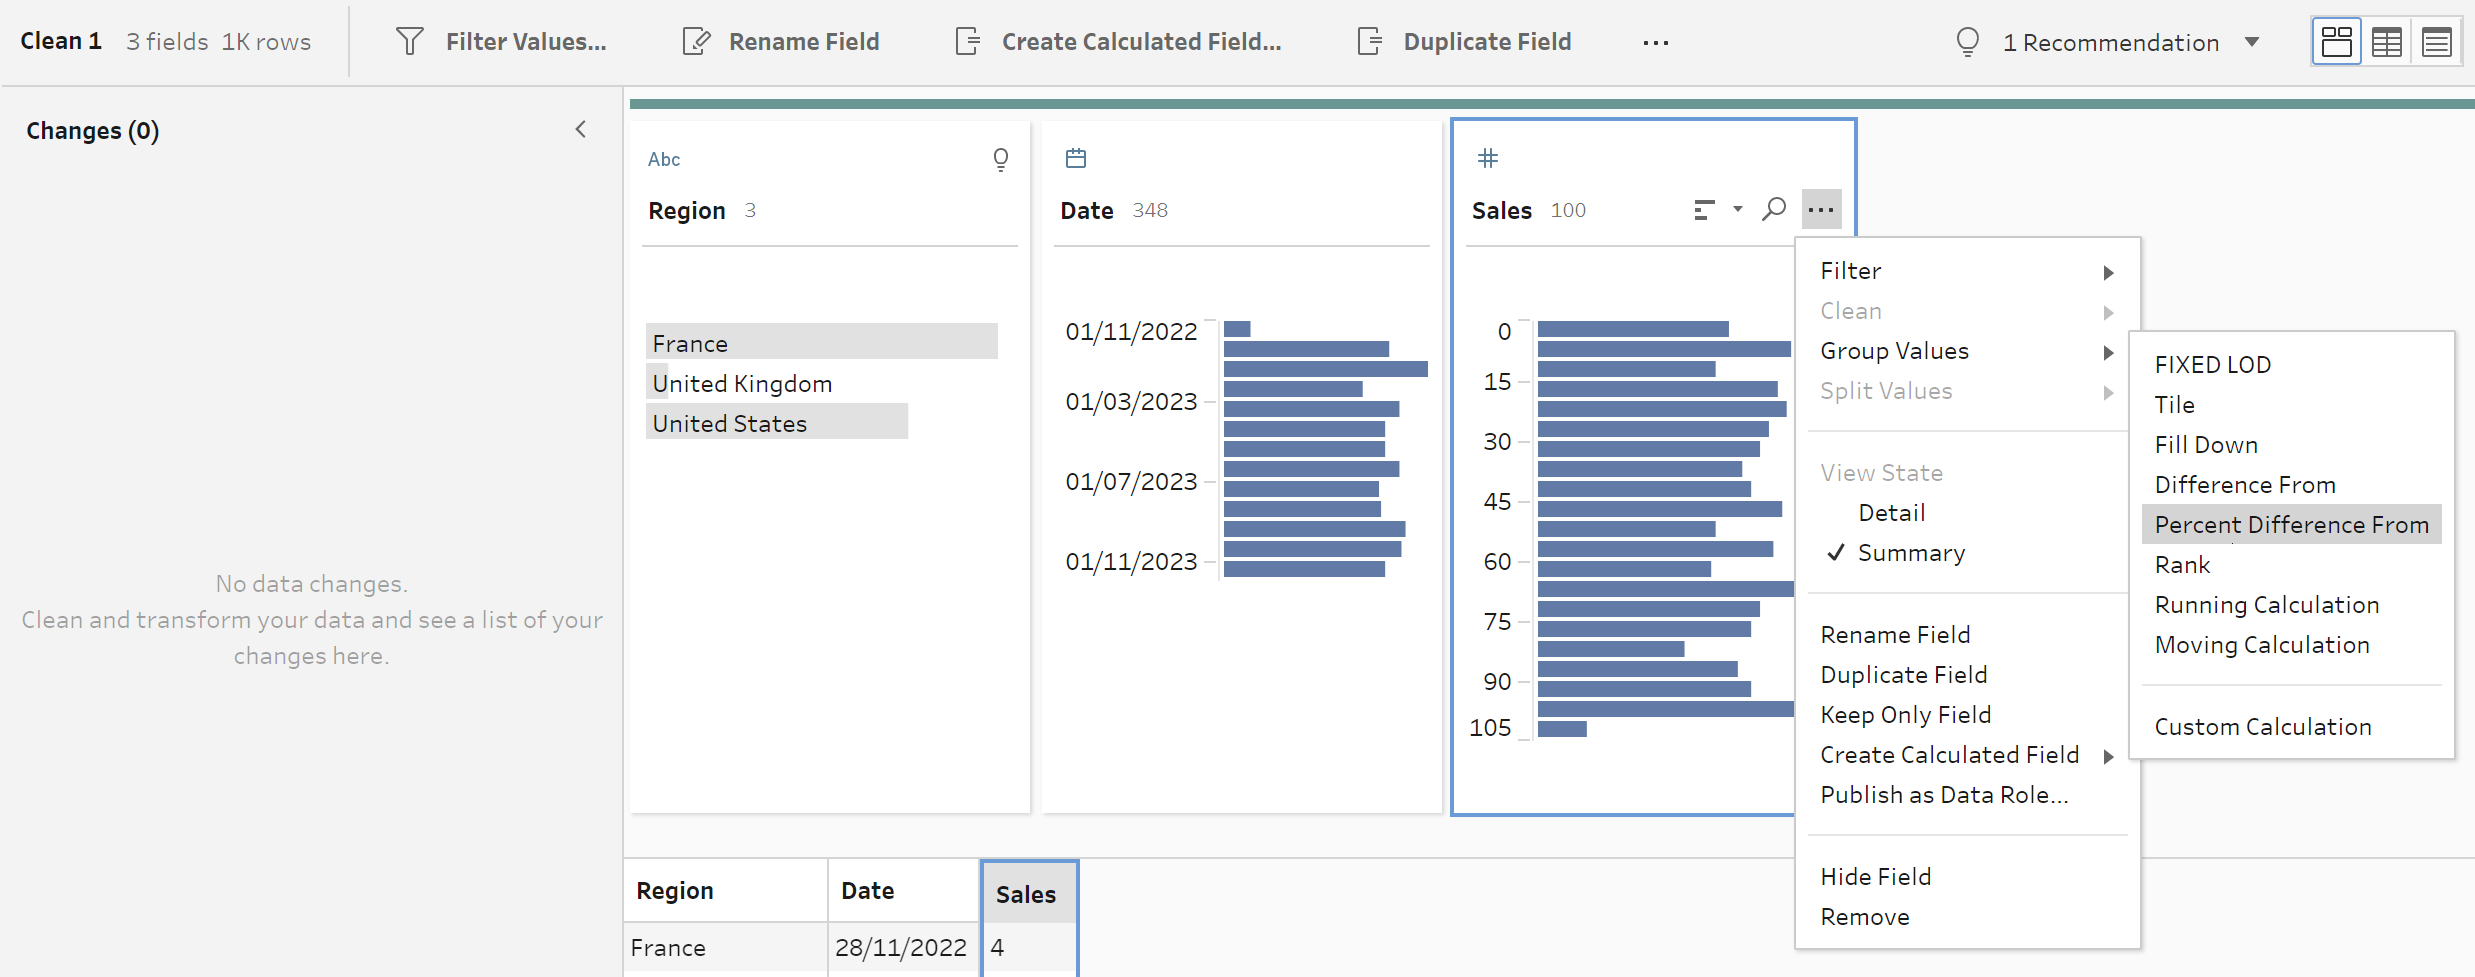
This will take you to the table calculation window.
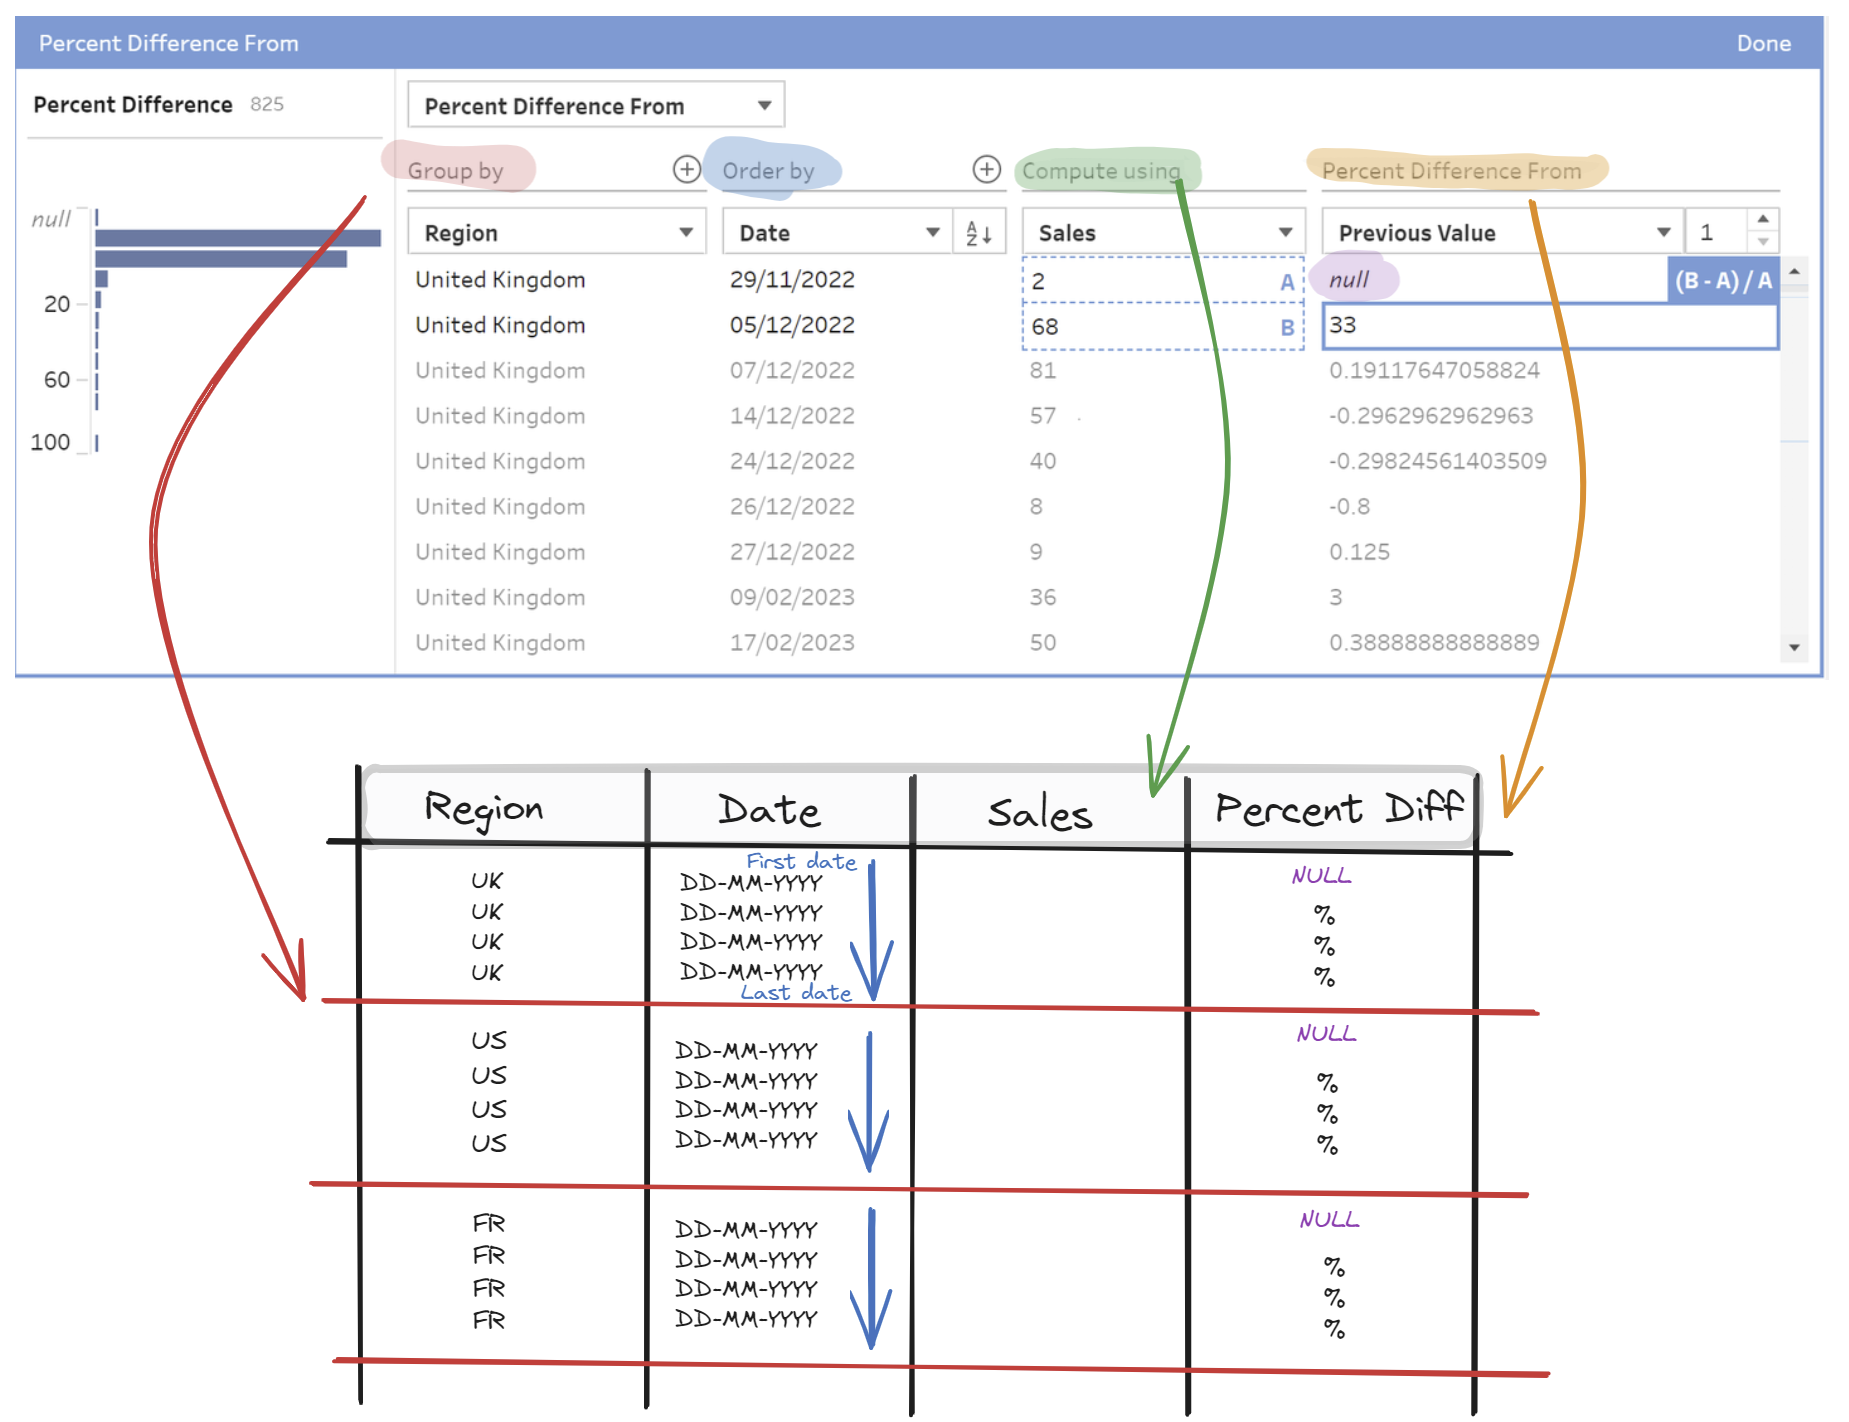
- We want to know the percentage difference between daily sales for each country. Therefore we select Region under Group by so the percentage difference calculation restarts for each country.
- Since we want to see the daily sales, we will Order by the Date so it is in chronological order.
- We care computing the percentage difference using Sales.
- Finally, we want to see the change from the Previous Value. We also have the ability to calculate the percentage difference from the next value. We will have three nulls in our table since the calculation restarts every region and the first row doesn't have anything to compare to so it remains null.
- If we didn't Group by Region, it would go from the earliest date to the latest date, thus we would only have one null.
Hope this guide improves your understanding of the "Percentage Difference From" calculation in Tableau Prep!