Today for Dashboard Week, we were using SQL and Snowflake to pull data out of a database in order to visualise it in Tableau!
Here's the brief!
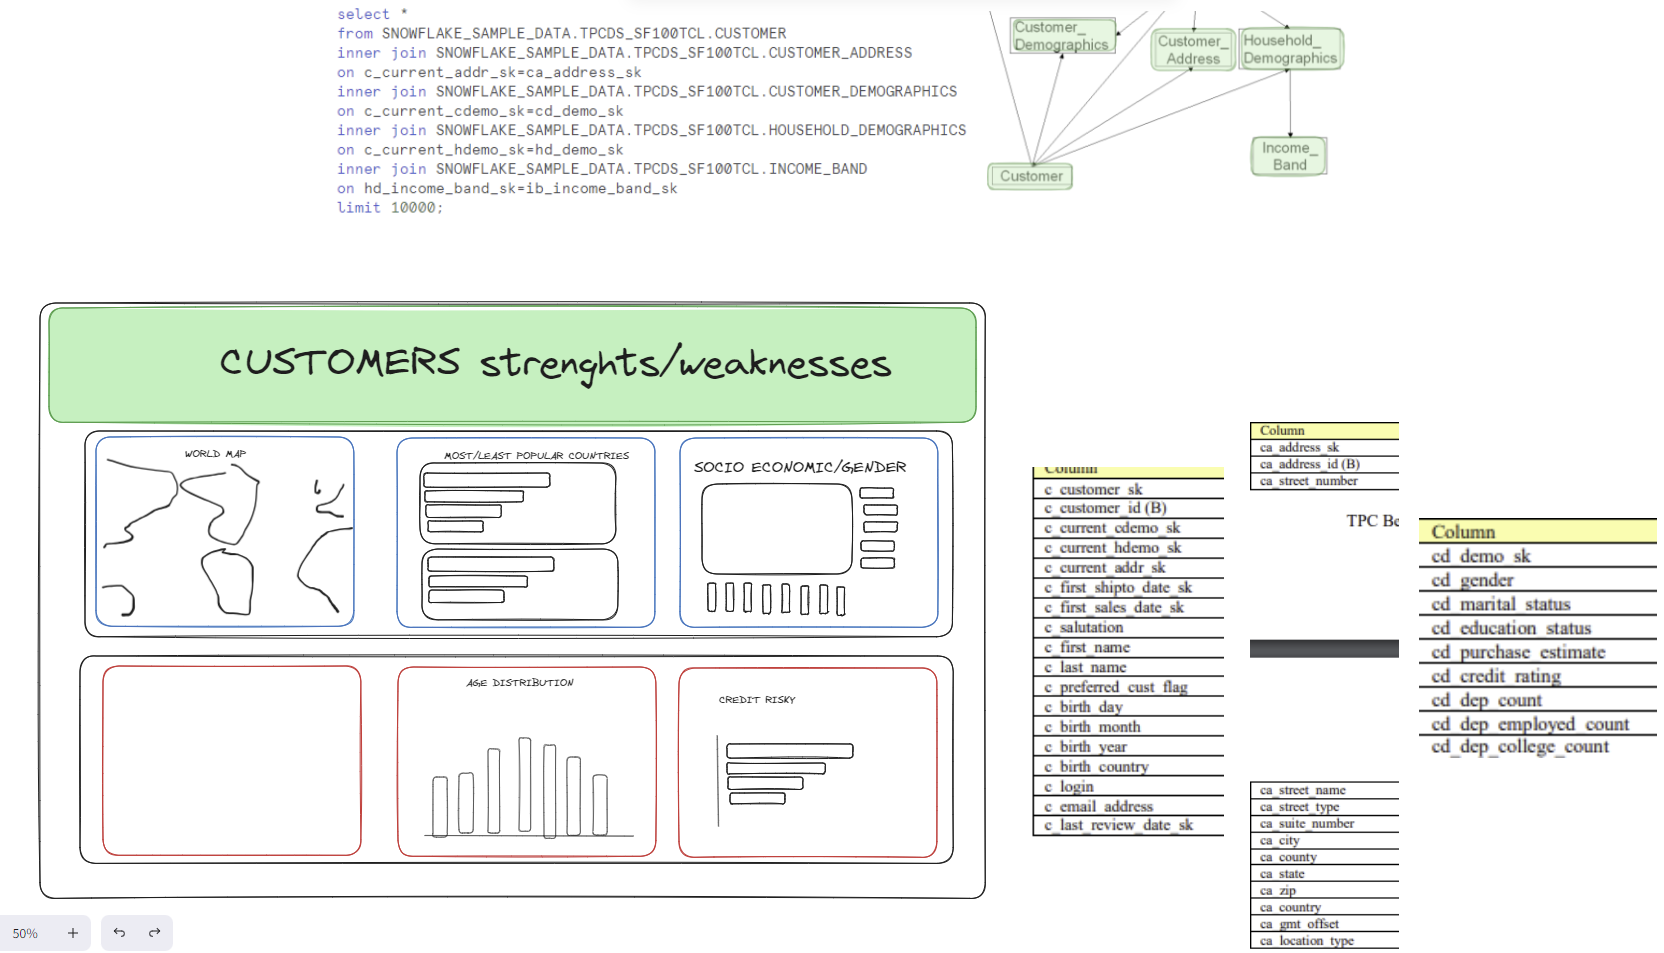
Investigate a portion of MoVer, a large retail company, managing, selling, and distributing products. Access the Snowflake database, containing various fact and dimension tables related to customer purchases, returns, promotions, warehouse inventory, and customer profiles. MoVer wants to transition to daily data extracts for cost reduction, requiring careful SQL planning for data aggregations, joins, and calculations before importing into Tableau. Focus on a specific business element: find the top 10 selling Store Sales products by revenue, explore demographics influencing these sales, and identify other products bought by these demographics.
Here's the Quick Plan I made:
- Database Exploration:
- Use Snowflake worksheets to explore the Snowflake database.
- Understand the structure of fact and dimension tables, especially those related to Store Sales, customer purchases, and demographics.
- SQL Queries for Top 10 Selling Store Sales Products:
- Write SQL queries to identify the top 10 selling Store Sales products based on revenue.
- Utilize the LIMIT clause to prevent querying the entire dataset unnecessarily.
- Demographic Analysis:
- Identify demographic categories contributing most to the sales of the top 10 products.
- Join relevant tables to gather demographic information and calculate contributions.
- Product Affinity Analysis:
- Determine what other products are commonly bought with the top 10 selling products.
- Use SQL to find associations and relationships between products.
- Tableau Integration:
- Connect Tableau to the Snowflake database using the identified schema.
- Utilize the New Custom SQL function to implement the SQL queries for top products, demographics, and product affinities.
- Visualization in Tableau:
- Create Tableau sheets and dashboards to visualize insights.
- Utilize the 'New Story' feature to organize findings into a cohesive narrative.
- Final Presentation:
- Prepare a final presentation summarizing the investigation, insights, and recommendations.
- Ensure the presentation addresses MoVer's objectives and provides actionable information for decision-making
Sadly I encounter many issues in todays task. The Schema we were using in snowflake was big (one might say too big...) and because all of my cohort was using the same server, extracting and creating new queries was a very so process.
Even though I managed to connect the store level and customer level data, I didn't end up using it because it was so slow to build with. I had to make a decision between hoping my queries would load or descope and focus on the customer data.
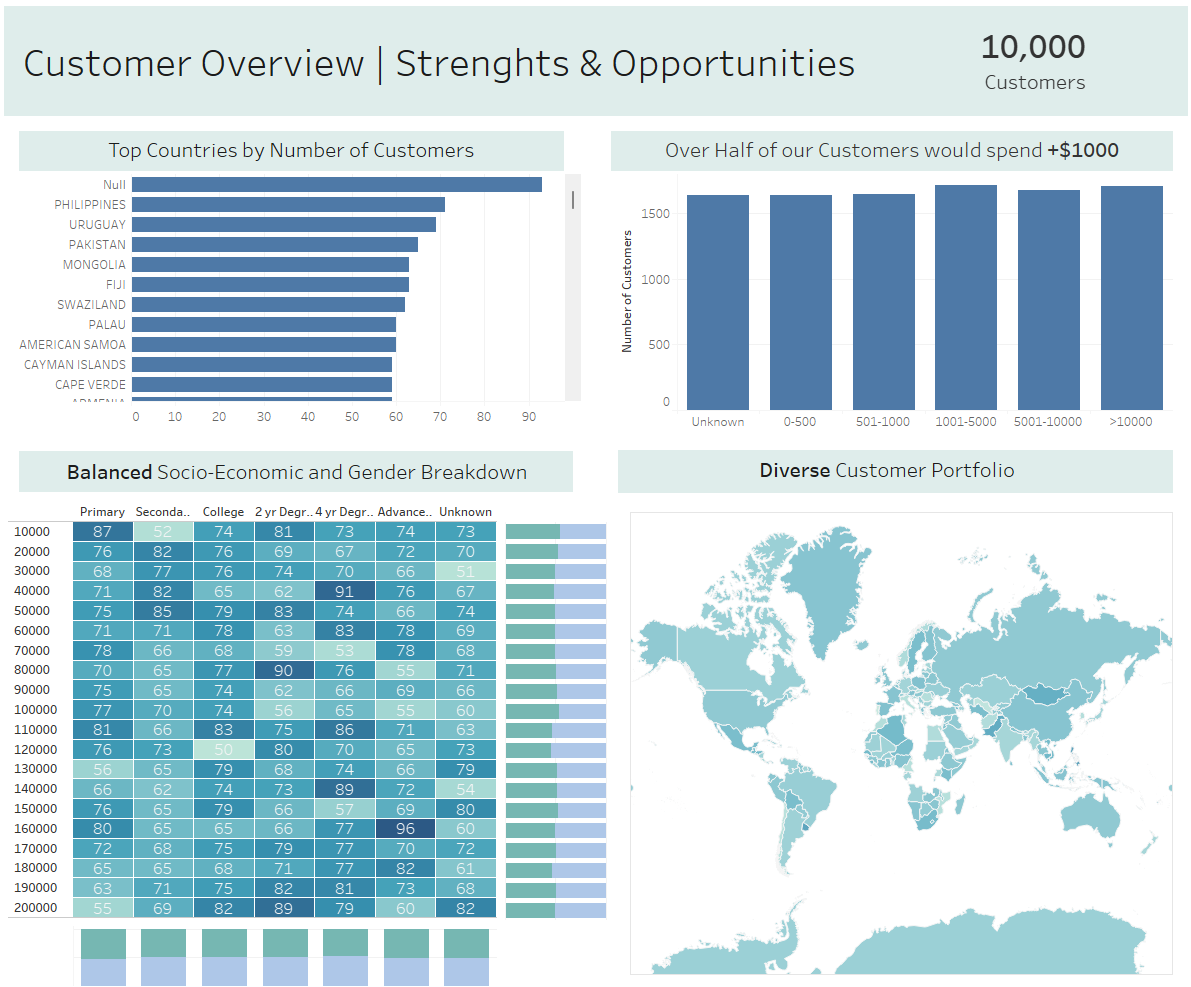
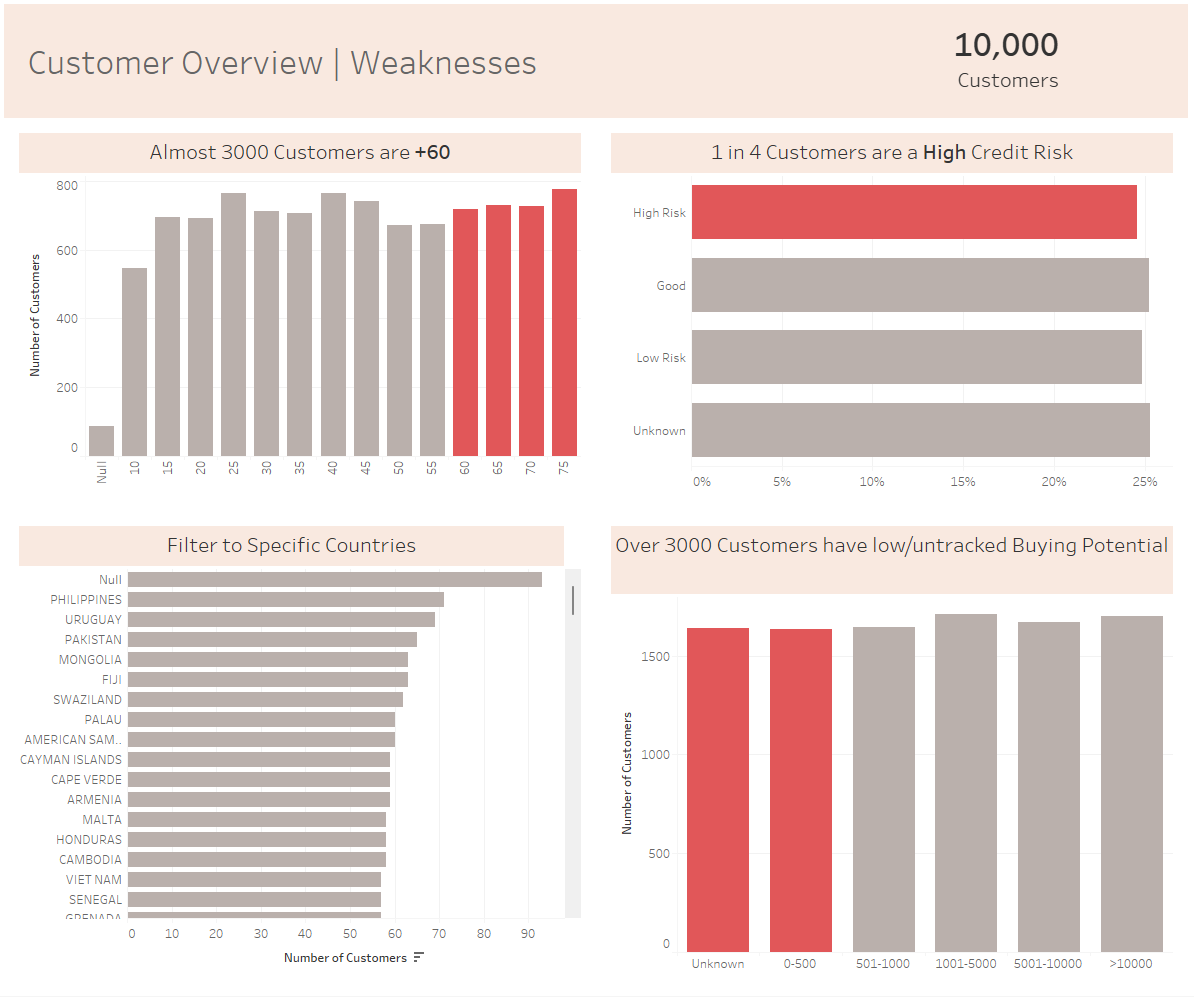
I ended up visualizing the customer data and showcase MoVer's strengths and weaknesses in terms of their customers.
Here was my new plan/sketch:
Here are my dashboards