Welcome back to Dashboard Week, where we embark on a journey to design and create two powerful templates using the dynamic duo of data visualization - Tableau and Power BI. Today, we'll be diving into the intricacies of crafting templates for the Sample Superstore and HR Data datasets, unlocking the potential for quick insights, inspiration, and efficient reporting.
Unveiling the Datasets: A Tale of Superstore and HR Trends
Sample Superstore: Beyond the Obvious
The Sample Superstore dataset needs no introduction. However, our challenge is to present it in a way that goes beyond the surface, unraveling trends, and providing a comprehensive understanding of sales, regions, and products.
HR Data: Decoding Hiring Strategies
In the realm of Human Resources, our HR dataset delves into the world of new hires, active employees, and those who have left. Aiming to identify trends in hiring strategies, biases, and voluntary separations, this dataset offers valuable insights for HR professionals across industries.
The Blueprint: Crafting Templates with Precision
- KPIs
To provide a holistic view, our templates incorporate a variety of charts and key performance indicators (KPIs). We don't just present numbers; we add context with Year-to-Date (YTD), Month-to-Date (MTD), and trending indicators, amplifying the depth of insights.
- Interactivity Examples
Interactivity is the heartbeat of a dynamic dashboard. We showcase examples of on-hover effects, click functionalities, and drillthroughs, enabling users to engage with the data, uncovering layers of information seamlessly.
- User Guidance
An information button, image, or a separate dashboard page acts as a guide, ensuring that users can navigate and interpret the templates effortlessly. Clarity in usage enhances the user experience, making our templates user-friendly.
- Designer's Signature Footer
Every masterpiece needs a signature. Our templates are no exception. A footer containing the designer's signature adds a personal touch, representing the craftsmanship behind the data visualization.
Showcasing Excellence: Tableau Public & Power BI Workspace
Our creations don't stay confined; they are set free on Tableau Public and Power BI Workspace, publicly shared for the world to see. The accessibility of these templates allows for seamless integration into your projects, providing a shortcut to impactful data visualization.
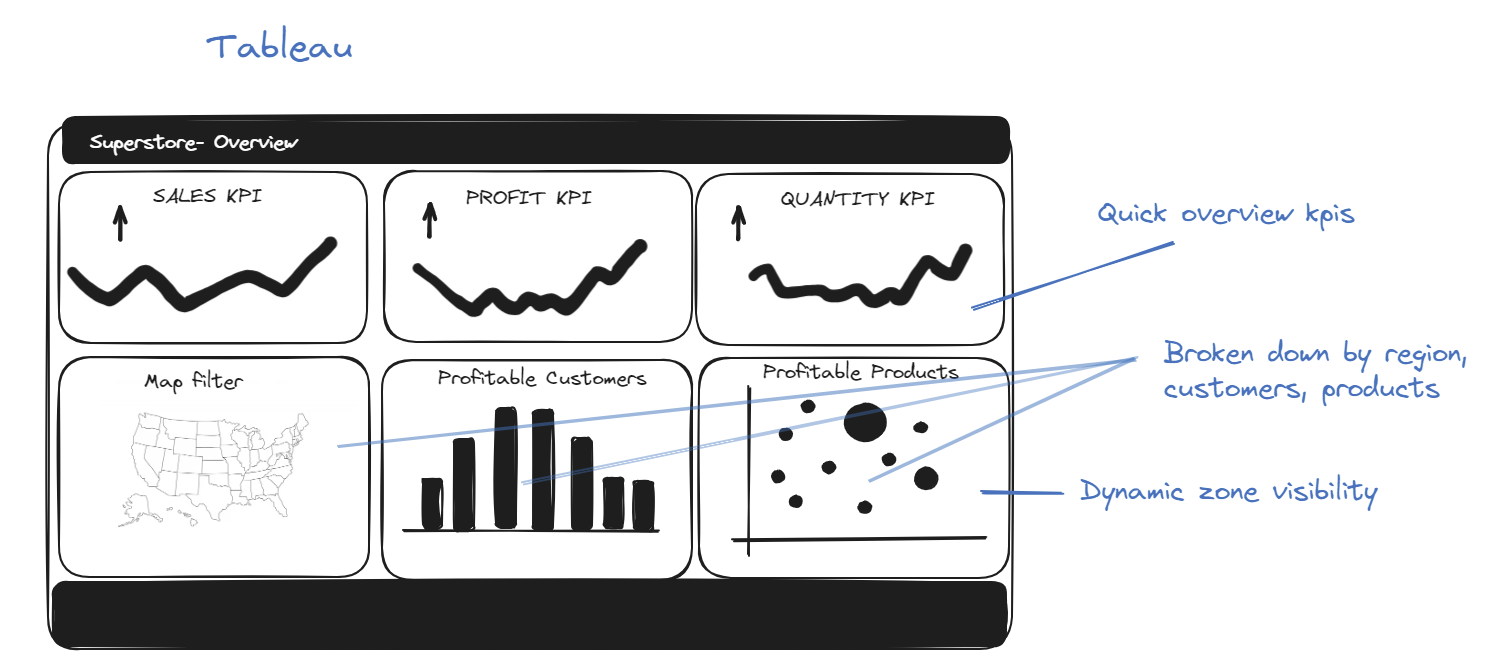
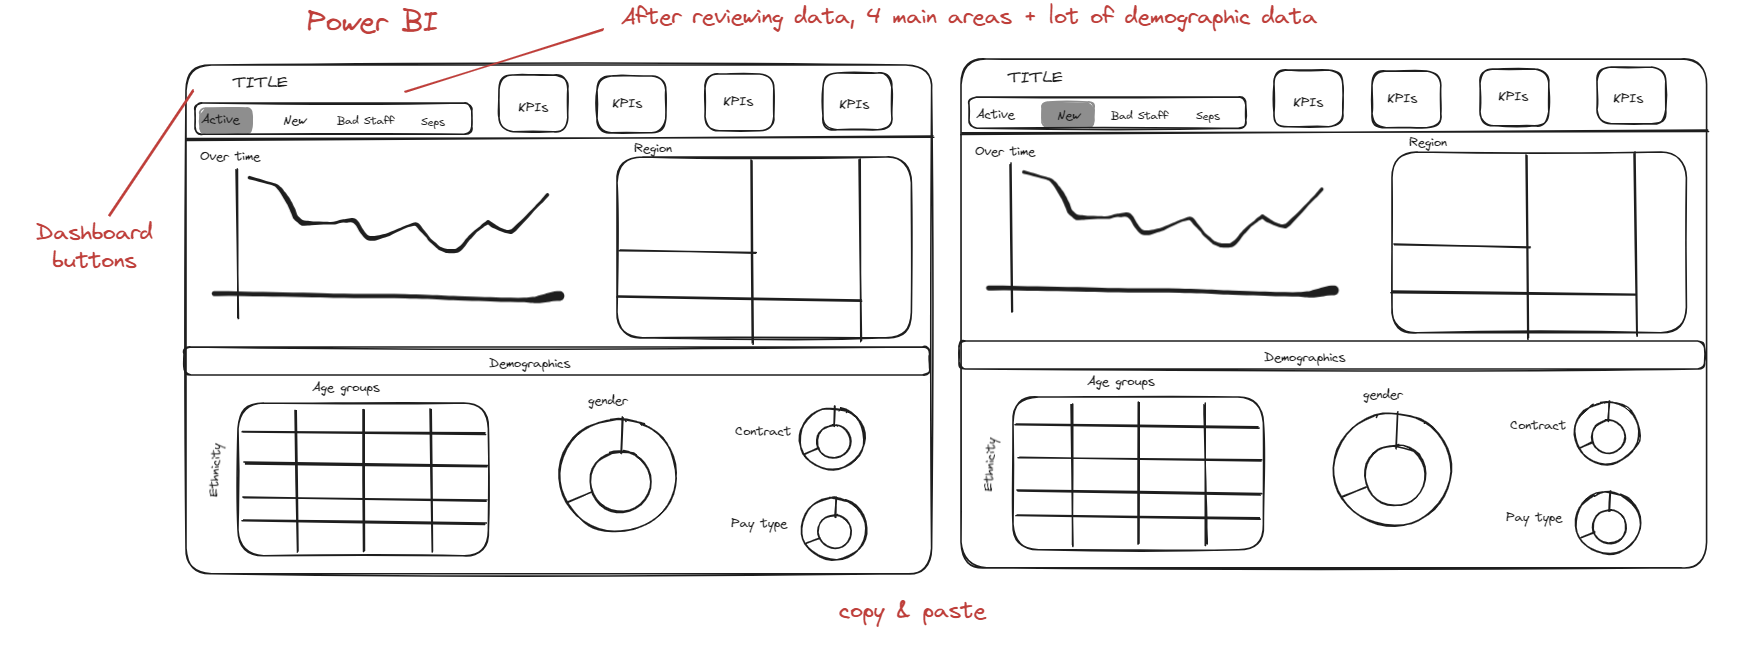
Here are my sketches:


During creation, I realized I wanted the ability to for a user to find specific orders after drilling down, I added a separate table in the dashboard.
Here are my embedded dashboards!
Conclusion: Elevating Data Visualization
Day 2 of Dashboard Week has seen us transcend traditional reporting models. With our Tableau and Power BI templates, we've not only saved time and stress but also opened doors to inspiration and insights. These templates are more than tools; they are gateways to a world where data speaks, trends emerge, and decisions become clearer!
