


The Multi-Row Formula Tool is a powerful yet sometimes overlooked feature that allows users to perform calculations across multiple rows of data with reference to positional features, opening the door to more complex, dynamic analysis.
Excel is a commonly used software that relies heavily upon positionality (E.G. Cell A1 etc); software such as tableau or Alteryx relies upon names. However, the multi row formula tool is one within Alteryx that relies upon positionality. This useful tool allows you to write formulas and expressions with reference to the name of a field and its subsequent (+) or prior (-) rows (generally up to 3 +/-).
Whether you're calculating running totals, detecting changes over time, or comparing values between records, the Multi-Row Formula Tool enables you to introduce true context into your workflows. In this blog, I'll explain how this tool works, when to use it, and illustrate a practical example that can elevate your data processing game.

Once you have dragged in a multi-row formula tool into your flow, and connected it with a data input, you will be met with this view in the configuration window:
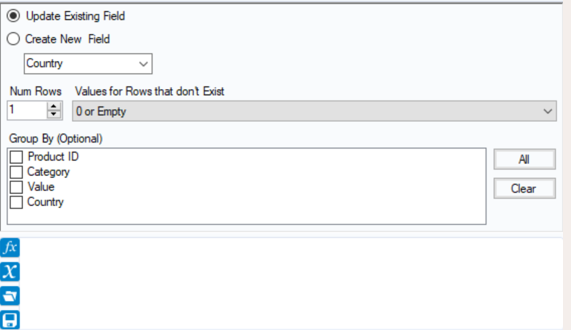
The method by which I begin to approach this configuration window, and perform an accurate multi-row formula, is by dividing it into five key questions that each relate to a section in the configuration window:
1) Are we Updating a currently existing column, or are we creating a new column?
2) How many rows subsequent (+) or prior (-) do we need to know to perform our formula?
3) What do we want the value of the prior rows that don't exist to be? E.G. What do we want the value of row no. 0,-1,-2 etc to be?
4) Do we want to aggregate?
5) What do I want my formula to be?
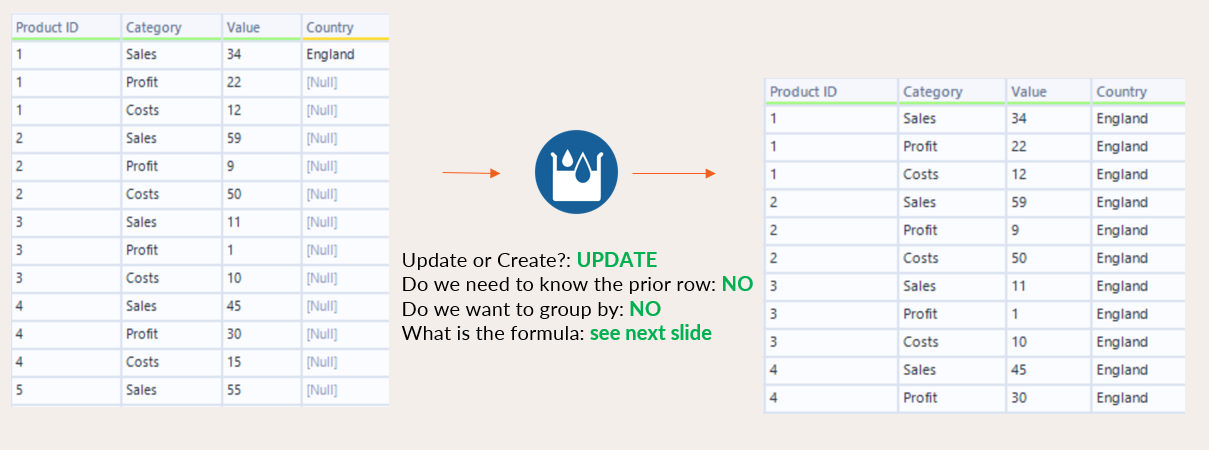
In the example as follows, we want all subsequent rows to say England and if there is a new Country mentioned, then we want these data points to be dragged down:
Once you can answer these questions, it's very easy to relate them to the questions that Alteryx is indirectly asking you in the configuration window. See the following image to understand which questions relate to what sections of the configuration window:
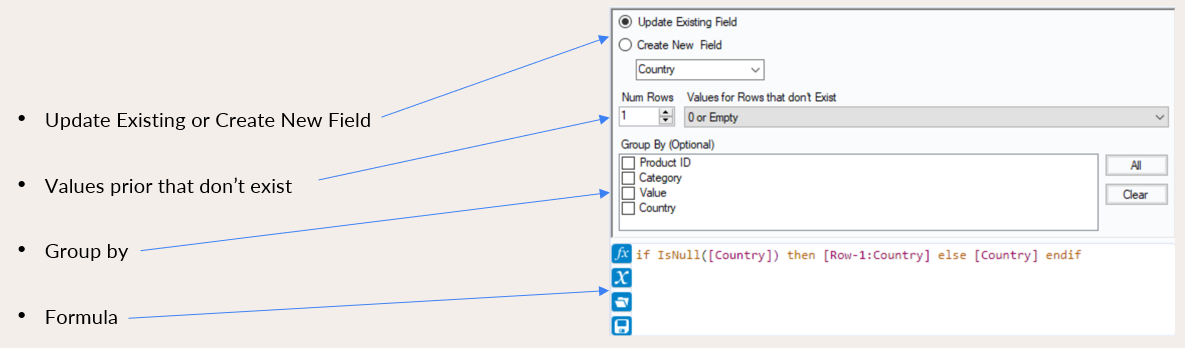
The formula is explained as follows: If [Country] is null then we want to take the row prior to the data point within that column, otherwise keep the [Country] in the field.
Some common use cases for the Multi-Row Formula Tool include:
- Calculating running totals or cumulative sums – Great for financial data, sales tracking, or any scenario where you need to see a progressive accumulation of values across rows.
- Identifying changes between rows – Useful for flagging shifts in status, detecting anomalies in time series data, or comparing daily performance metrics.
- Filling in missing values – By referencing previous or subsequent rows, you can intelligently populate null fields with contextually appropriate data.